


Project Overview
In this project, I set up and deployed a fully automated Security Operations Center (SOC) within a virtual lab environment. The main challenge I tackled was the inherent inefficiency of manual incident detection and response. My solution brings together Wazuh (XDR/EDR) for thorough endpoint monitoring, TheHive (Incident Response) for organized incident management, and Shuffle (SOAR) for orchestrating automated workflows. By using Sysmon logs and creating custom rules, I built a robust system capable of simulating, detecting, and responding to advanced threats like Mimikatz in real-time. This setup shows my proactive approach. I transformed raw security events into actionable intelligence and automated critical response actions. Wazuh detected the threat, and the custom integration script successfully forwarded the alert to TheHive for immediate case management. Furthermore, automated email notifications were sent to the SOC analyst, enabling rapid case management. This automated alert creation significantly reduces response time and ensures critical incidents are promptly addressed, showcasing my ability to build resilient and efficient security operations.
Key Skills Demonstrated
Wazuh, TheHive, Shuffle, Sysmon, SOAR, XDR, EDR, log analysis, alert automation, incident response, rule creation, virtualization, API integration, troubleshooting, playbook, and workflow orchestration.
Workflow
Here is the project workflow that minimizes manual intervention, ensuring that critical security incidents are detected, enriched with threat intelligence, escalated for case management, and communicated to the response team with unparalleled speed and efficiency. This project's success comes from a carefully designed automated workflow, ensuring rapid and consistent incident response. Here's a breakdown of the automated process:
Endpoint Monitoring & Log Ingestion
A Windows 10 endpoint, equipped with Sysmon, generates security events. The Wazuh agent on the endpoint collects these Sysmon operational logs and forwards them to the Wazuh Manager. Wazuh is configured to ingest and archive all raw logs into Elasticsearch for comprehensive visibility and future analysis.
Threat Detection & Custom Rule Creation
To detect specific threats like Mimikatz, I developed and put in place a custom Wazuh rule. This rule precisely identifies Mimikatz execution based on originalFileName within Sysmon event data, assigning a critical severity level and linking it to MITRE ATT&CK T1003 (OS Credential Dumping). Upon Mimikatz execution, Wazuh immediately generates a high-fidelity alert.
Automated Incident Creation in TheHive
I developed and deployed a custom Python integration script on the Wazuh Manager. This script is configured in ossec.conf to automatically forward critical Wazuh alerts, including our Mimikatz detection, directly to TheHive. TheHive receives these alerts and automatically creates new cases for incident management, filling them with all relevant details from the Wazuh alert.
SOAR Orchestration & Threat Intelligence Enrichment (Shuffle)
Wazuh alerts are also forwarded to Shuffle via a dedicated webhook. Shuffle's workflow automatically extracts the SHA256 hash from the Mimikatz alert data using a regex capture group. This extracted hash is then used to query VirusTotal via its API, enriching the alert with real-time threat intelligence and confirming the malicious nature of the executable.
Automated Analyst Notification
As the final step in the Shuffle workflow, an automated email notification is sent to the analyst. This email, filled with critical alert details (e.g., alert title, filename, affected host), ensures immediate awareness and prompts the analyst to initiate their investigation in TheHive.
Let's get started!
Lab Network Setup Diagram
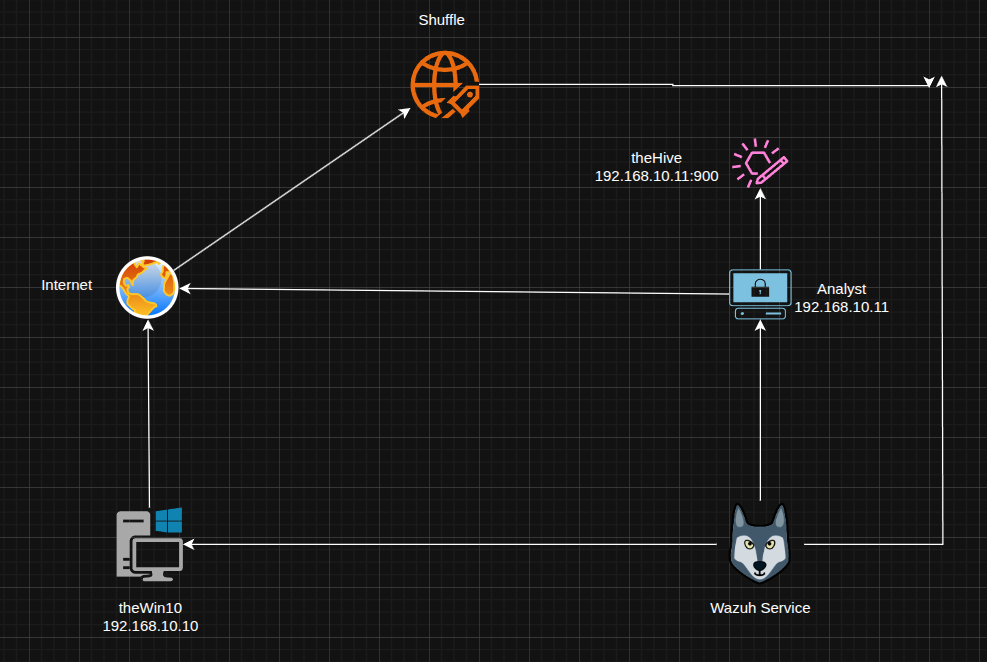
This diagram illustrates the lab's network setup: A Windows 10 endpoint generates security events, which are monitored by Wazuh (XDR/EDR). TheHive (incident management) and Shuffle (SOAR) are integrated to manage and automate responses, with the Analyst PC used for monitoring and analysis.
Installing Wazuh
Let's begin by installing Wazuh, the XDR/EDR platform, to establish core security monitoring and detection capabilities. The installation was performed using the official Wazuh script: curl -sO https://packages.wazuh.com/4.12/wazuh-install.sh && sudo bash ./wazuh-install.sh -a

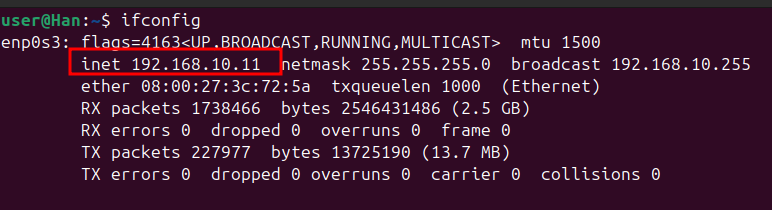
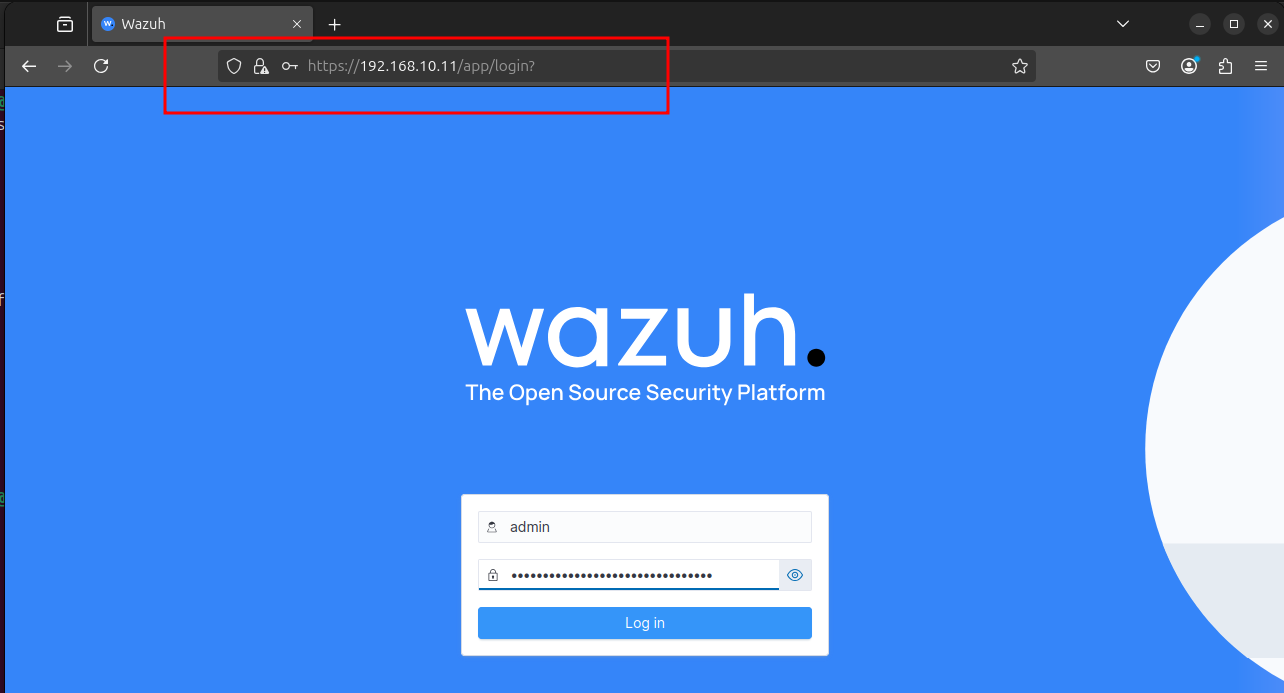
To access the Wazuh dashboard, I first confirmed the IP address of the Wazuh service. The ifconfig output revealed 192.168.10.11 as the assigned IP, which was then used for web interface access.
With Wazuh installed, the next step is to deploy an agent to the Windows 10 endpoint. As seen here, the dashboard currently shows no registered agents, prompting the "Deploy new agent" action to begin monitoring the endpoint.

Configuring Agent Deployment
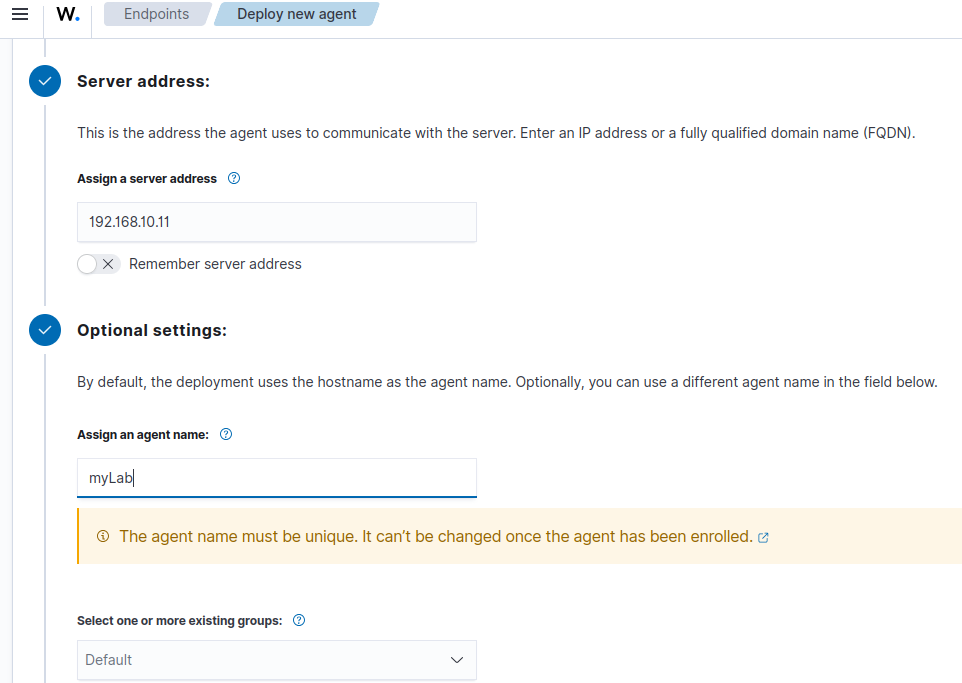
To deploy the Wazuh agent to the Windows 10 endpoint, the server address 192.168.10.11 was assigned. An agent name, myLab, was also provided during this configuration step to uniquely identify the endpoint within Wazuh.
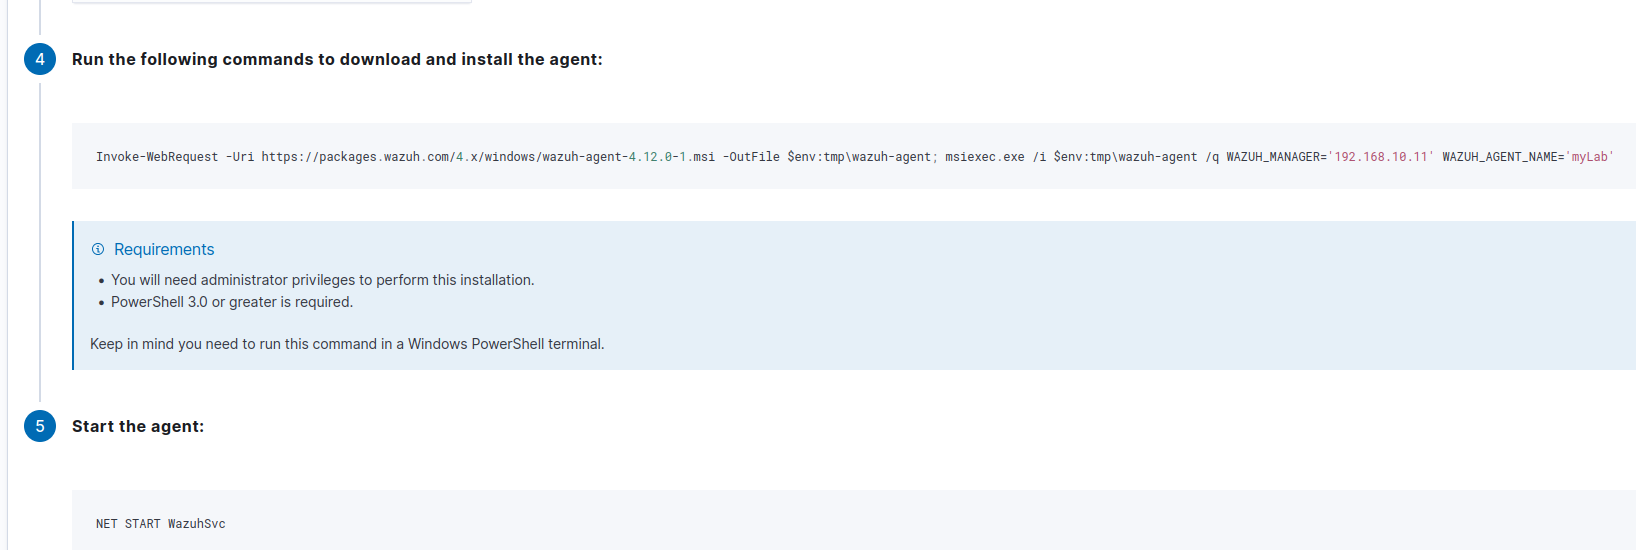
The Wazuh dashboard provides the specific PowerShell commands to download and install the agent on the Windows 10 endpoint. This includes the Invoke-WebRequest command to retrieve the installer and msiexec.exe for silent installation, ensuring the agent connects to the Wazuh Manager at 192.168.10.11 and is named myLab. Following this, NET START WazuhSvc starts the agent service.
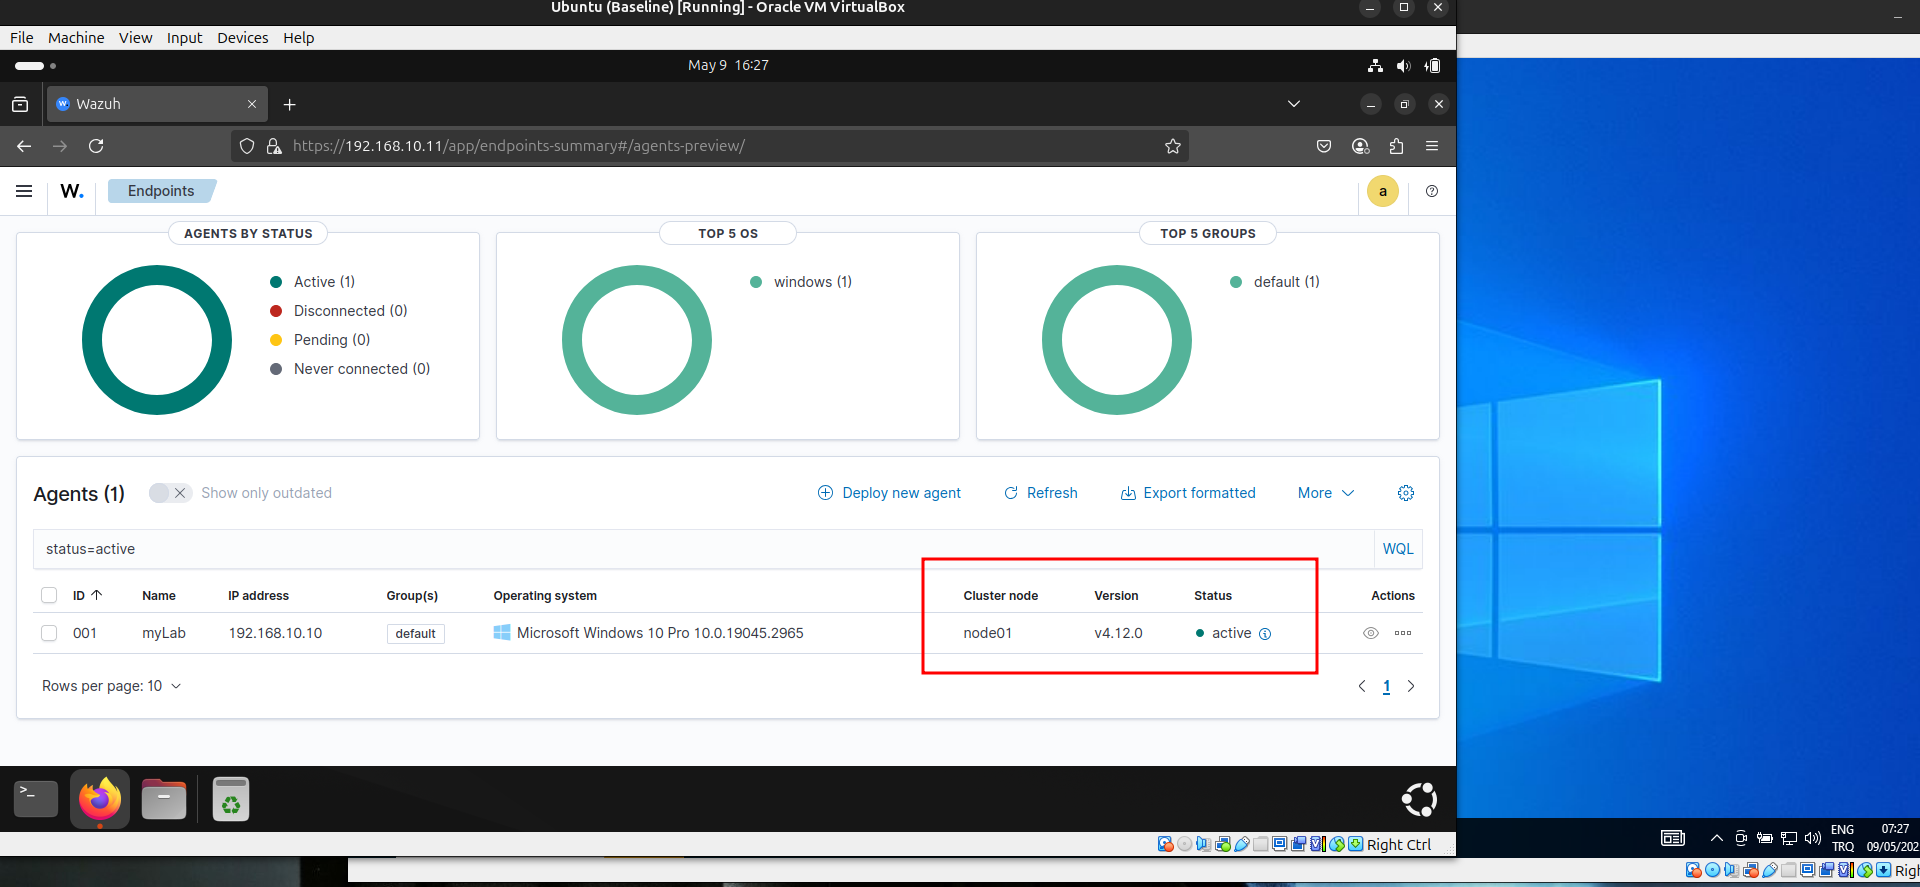
After running the deployment commands on the Windows 10 endpoint, the Wazuh agent successfully registered. The dashboard now displays "myLab" (192.168.10.10) as an active agent, confirming it is now sending security data for monitoring.
Installing TheHive
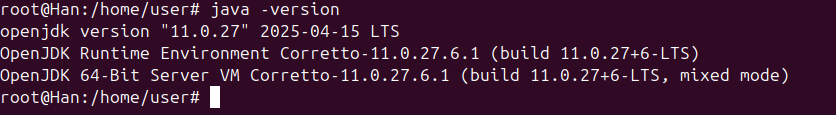
Next, we proceed with installing TheHive, the incident response platform. We are going to follow the official guide of TheHive : https://docs.strangebee.com/thehive/installation/step-by-step-installation-guide/ This begins by ensuring all necessary Java dependencies are in place.
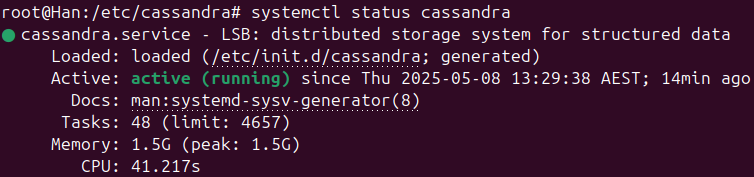
TheHive relies on Apache Cassandra for its distributed database.
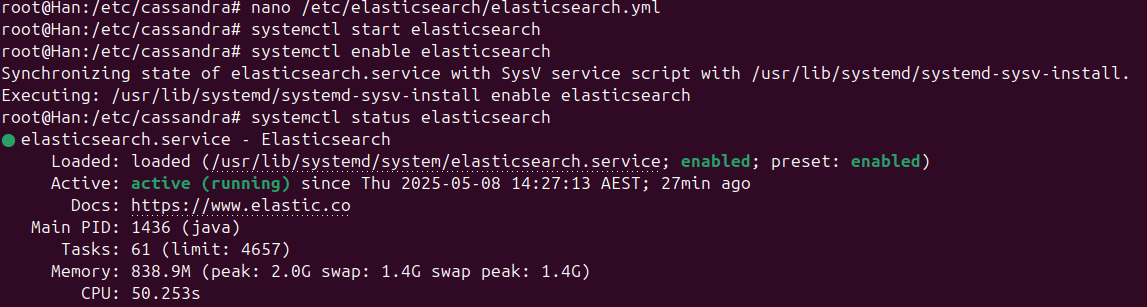
Elasticsearch is another dependency for TheHive, providing powerful search and analytics capabilities for incident data.
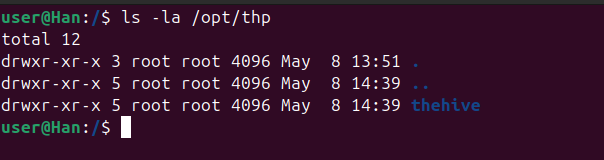
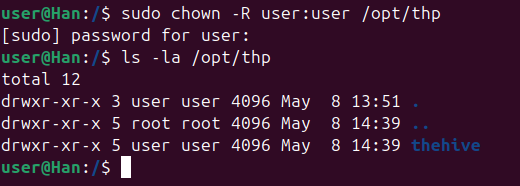
Now we are good to go for installing TheHive.After installing TheHive, it's crucial to correctly set file permissions to ensure proper operation and security. As shown in the ls -la /opt/thp output, the directory initially shows root as the owner. The official documentation mandates changing these permissions to thehive:thehive.
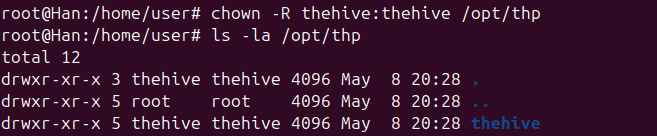
To align with TheHive's operational requirements, the file ownership for /opt/thp was changed recursively to thehive:thehive using the chown -R thehive:thehive /opt/thp command.
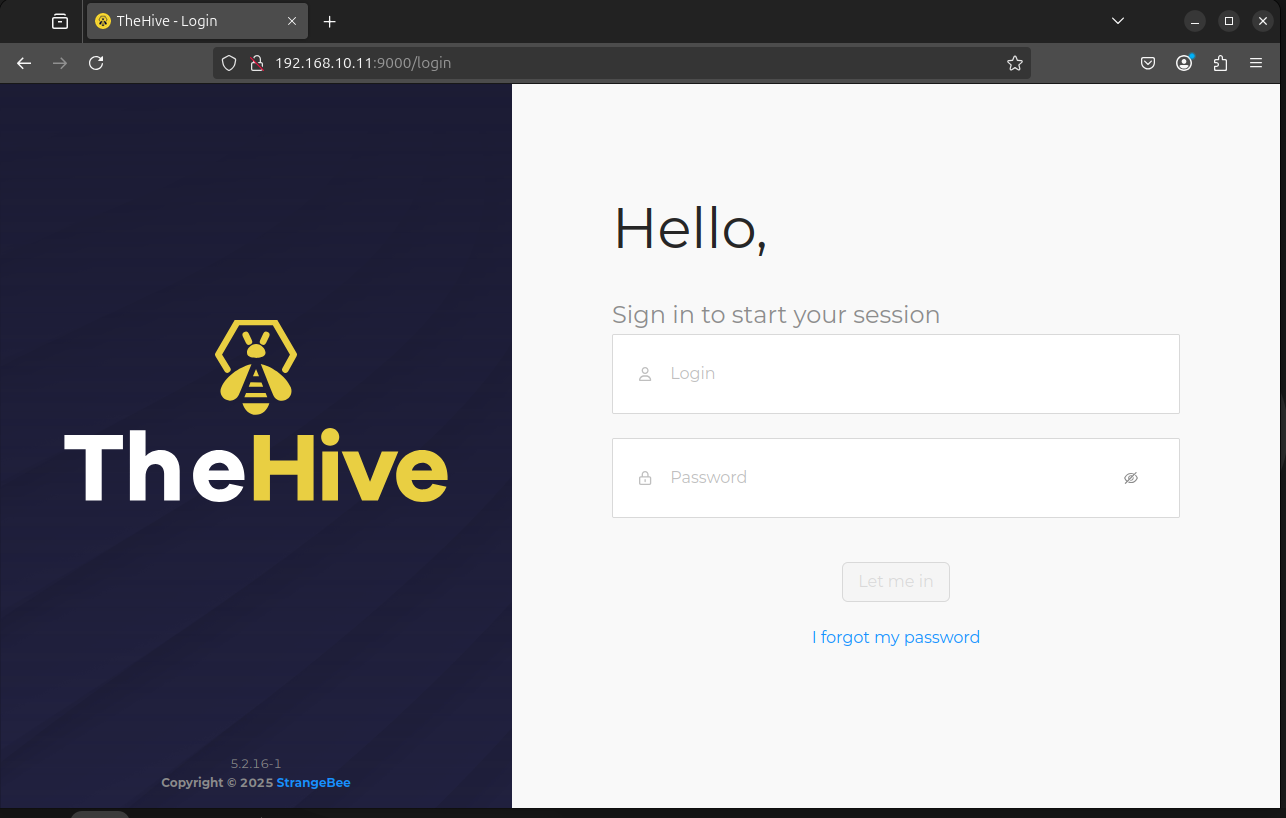
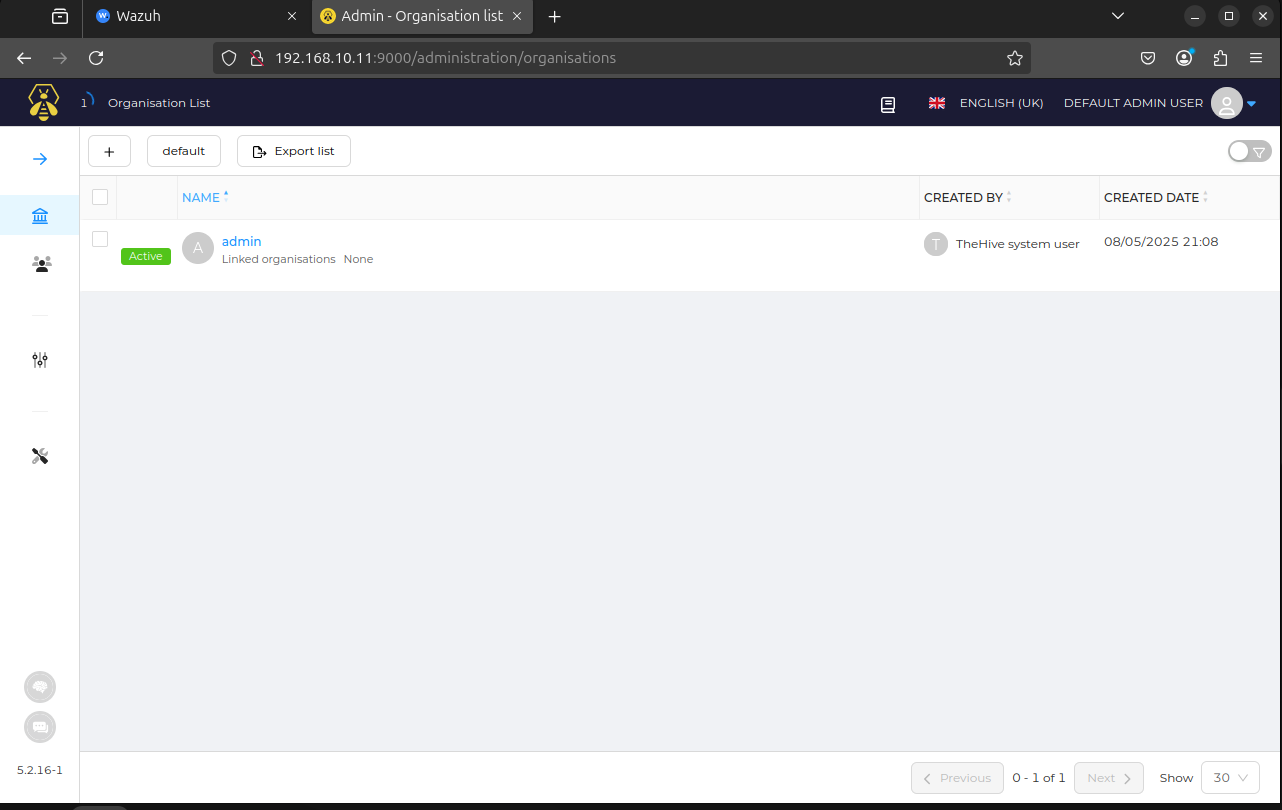
With the installation, permission adjustments and configurations complete, TheHive's web interface is now accessible, confirming the successful deployment and readiness for incident management operations.
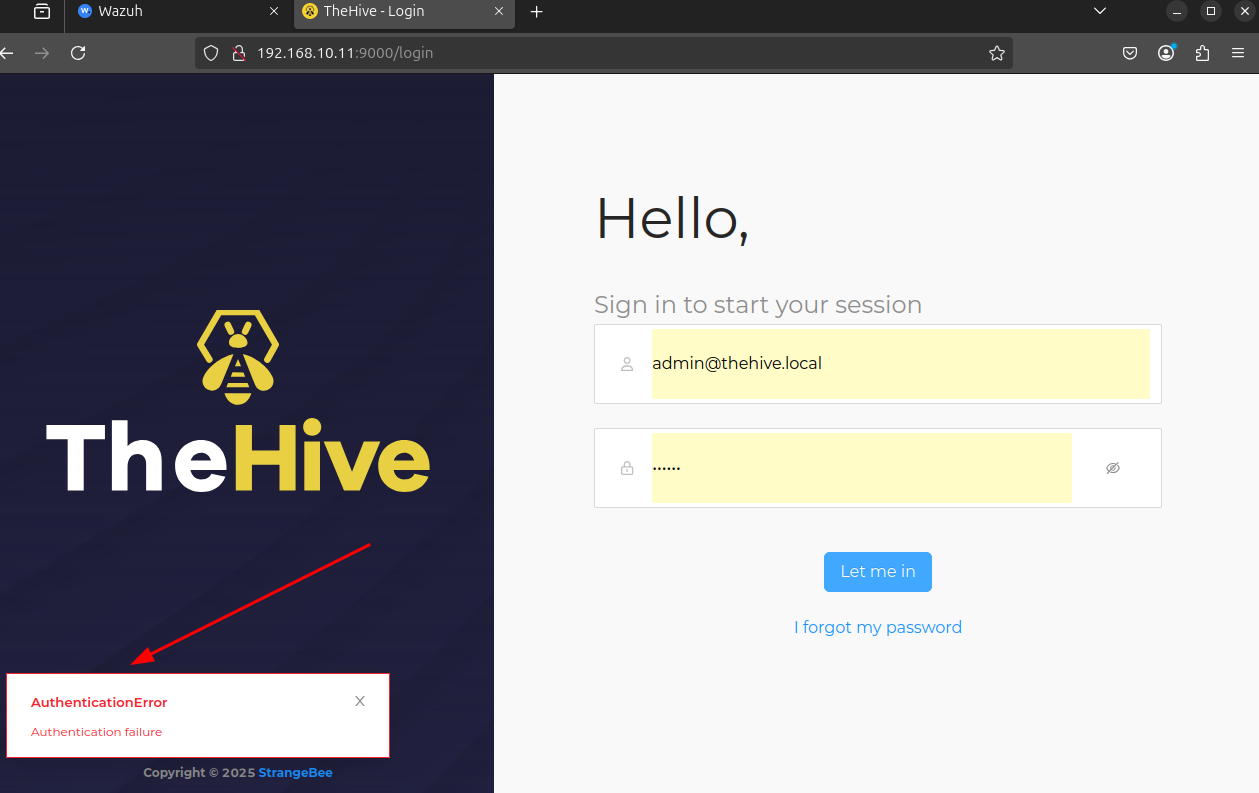
Default cretendials for the hive are : admin@thehive.local - secret When i try to login with this credentials there's an error occuring so now we have to solve this.
When i check the Elasticsearch service, i see that it failed to start due to it being killed by the Out Of Memory (OOM) Killer, indicating insufficient available memory to run the service.
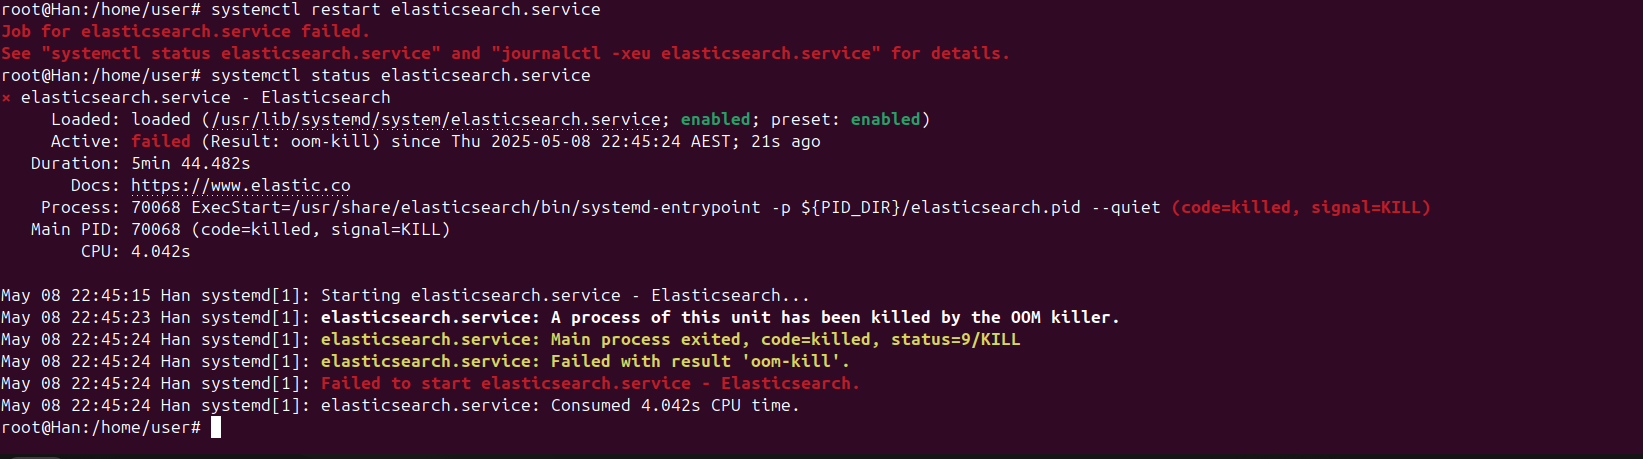
The OOM Killer is a mechanism in the Linux kernel that steps in when the system is critically low on memory. It selects and terminates processes to free up memory and prevent the entire system from crashing or becoming unresponsive. Elasticsearch, especially with default configurations or when handling significant data, can be memory-intensive. How to solve this problem: 1. Increase Available Memory: The most direct solution is to provide more RAM to the machine running Elasticsearch. If possible, upgrade the system's memory. 2. Reduce Elasticsearch Memory Usage: If you can't increase the RAM, you need to configure Elasticsearch to use less memory. This involves adjusting the JVM heap size that Elasticsearch uses. My solution : I don't want to reduce the performance of Elasticsearch so i'm gonna increase the RAM of my VM. With the increased RAM, the Elasticsearch service now runs without OOM issues, allowing TheHive to start and authenticate correctly.
Sysmon Integration
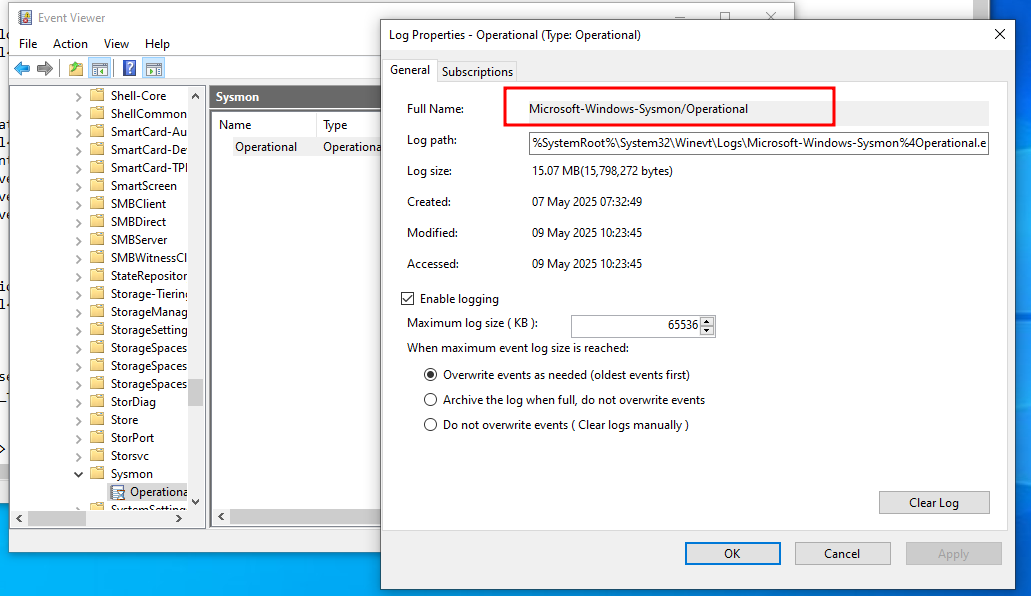
To ingest Sysmon logs into Wazuh for comprehensive endpoint monitoring, the full name of the Sysmon operational log (Microsoft-Windows-Sysmon/Operational) is identified within the Event Viewer.
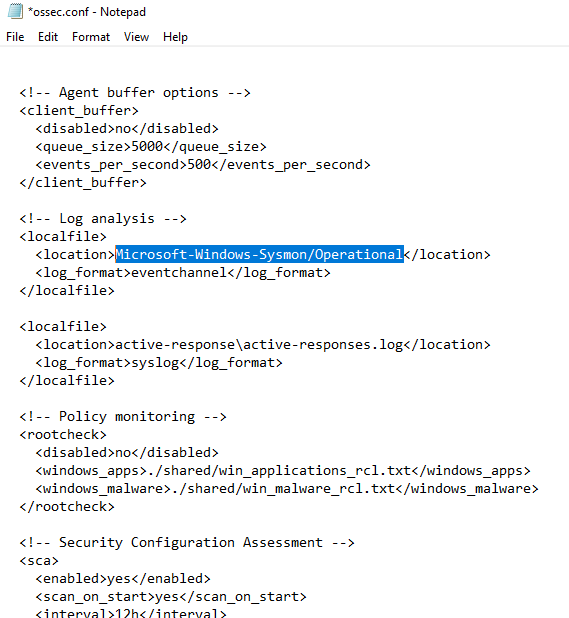
To integrate Sysmon logs with Wazuh, I modified the ossec.conf file on the Windows 10 agent. Specifically, I added a <localfile> entry, pointing to the Microsoft-Windows-Sysmon/Operational event channel, ensuring these security events are now collected and forwarded to the Wazuh Manager for analysis.
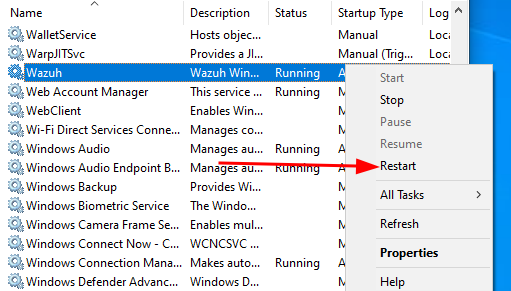
After modifying the ossec.conf file, I restarted the Wazuh agent service on the Windows 10 endpoint. This ensures the configuration changes take effect immediately, allowing the agent to begin collecting Sysmon logs as configured.
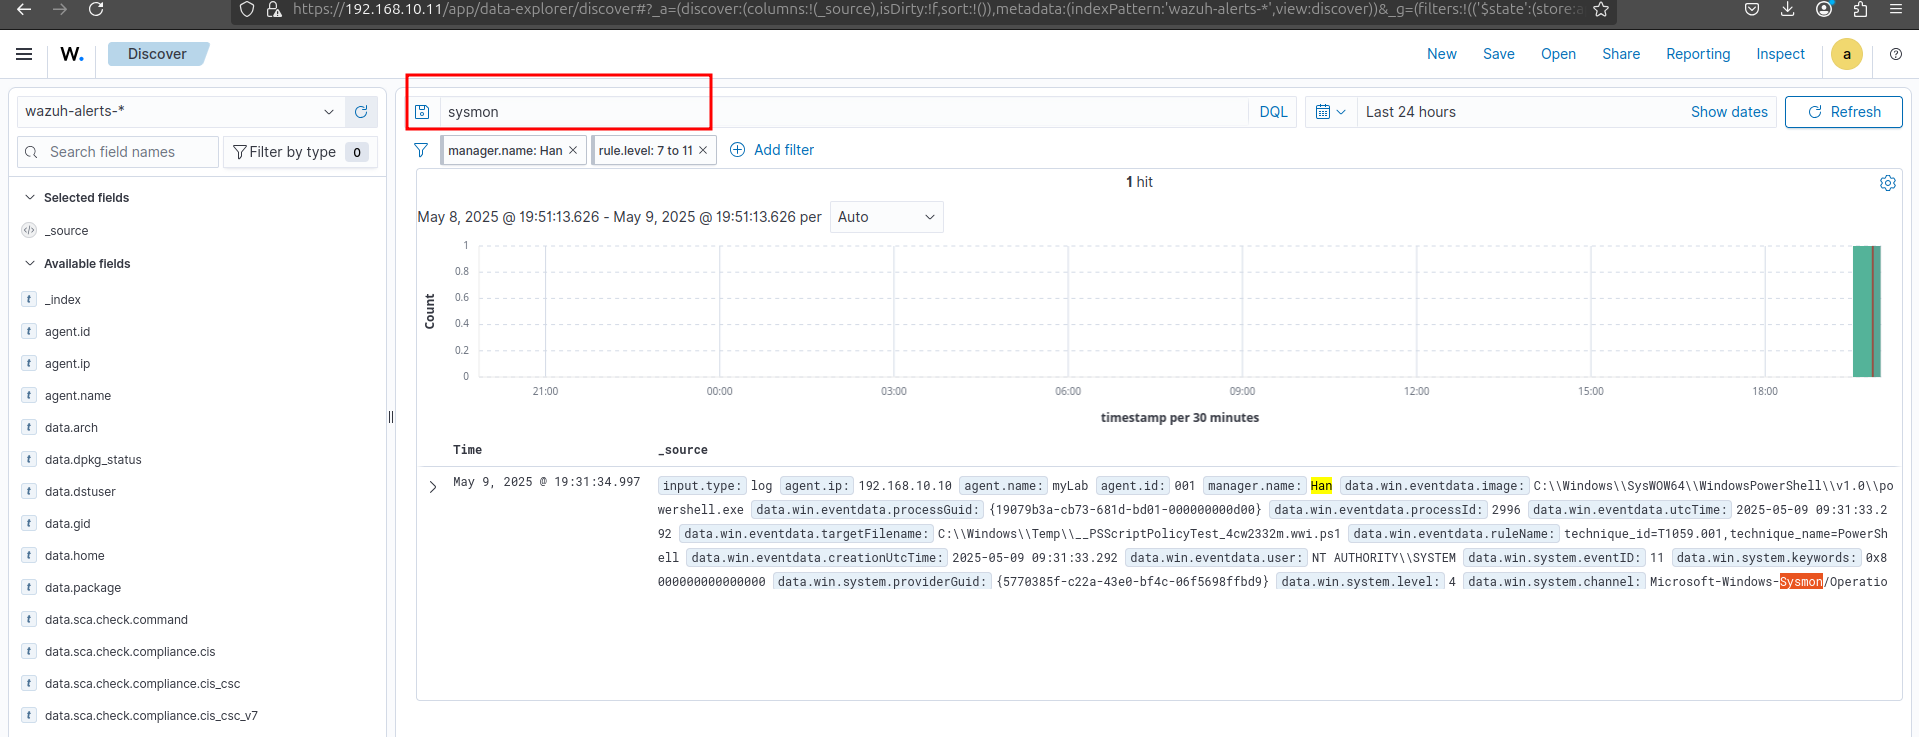
With the Wazuh agent restarted and properly configured, I verified that Sysmon logs are now being successfully ingested and displayed within the Wazuh dashboard. The search filter for "sysmon" confirms that relevant events from the Windows 10 endpoint are actively flowing into the system for monitoring and analysis.
Custom Rule Creation for Mimikatz Detection
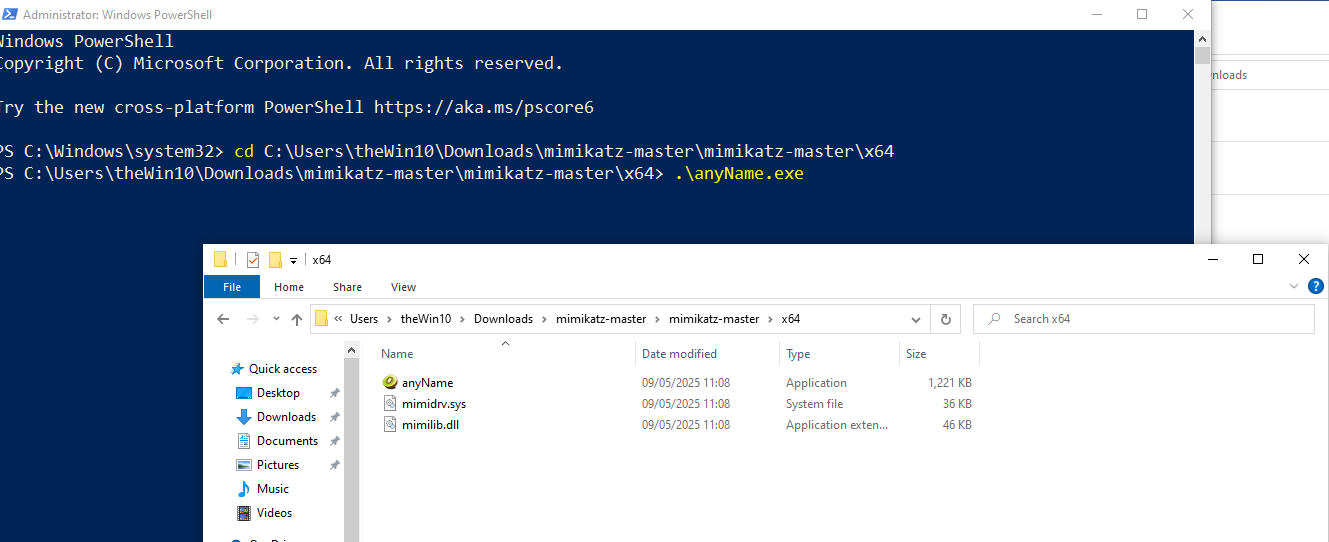
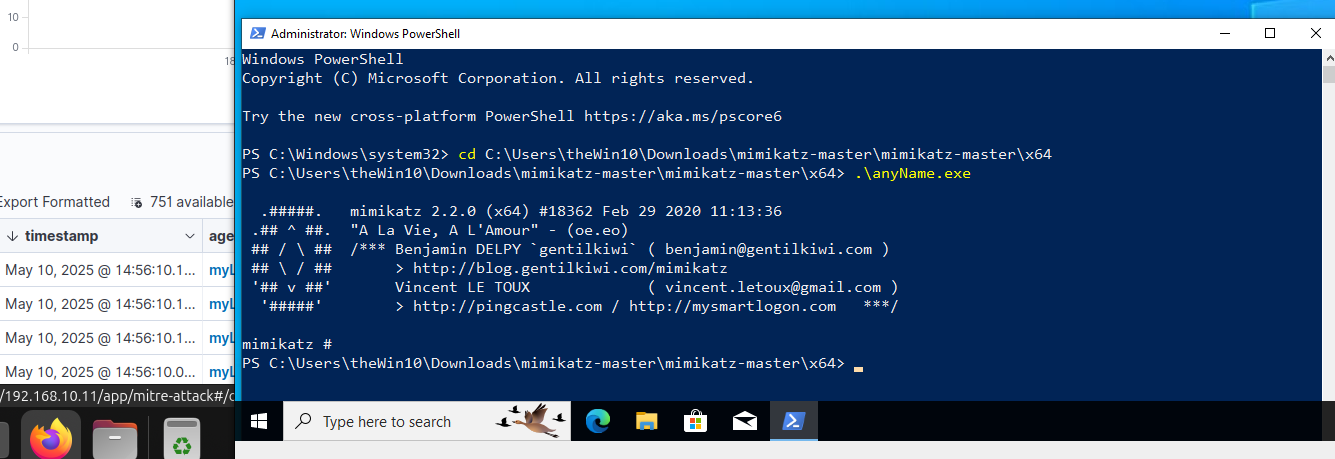
To simulate a real-world threat and test our monitoring capabilities, I executed Mimikatz—a tool commonly used for credential access—on the Windows 10 endpoint. This action is for generating specific security events that Wazuh is configured to detect and log.
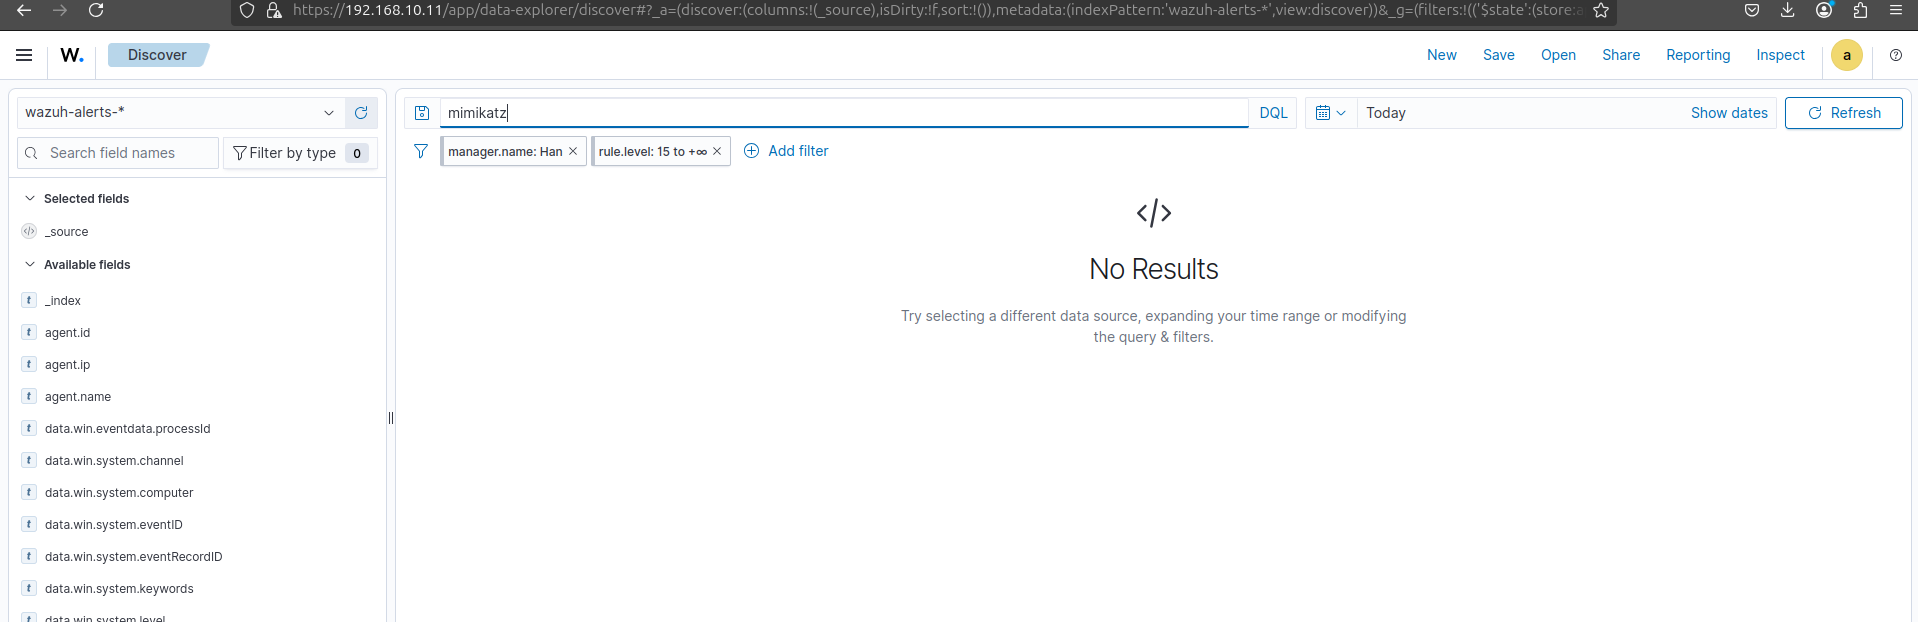
After executing Mimikatz, the Wazuh dashboard initially showed "No Results" for "mimikatz" alerts. This confirmed that while Sysmon logs were being collected, Wazuh's default ruleset did not yet contain specific detections for this type of threat, demonstrating the need for custom rule creation to enhance detection capabilities.
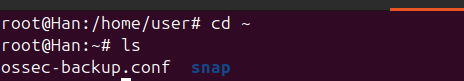
It's time to configure wazuh. But before modifying Wazuh's core configuration, I want to creat a backup of the existing ossec.conf file to ensure the ability to restore the original configuration if needed, minimizing disruption during rule development and testing.
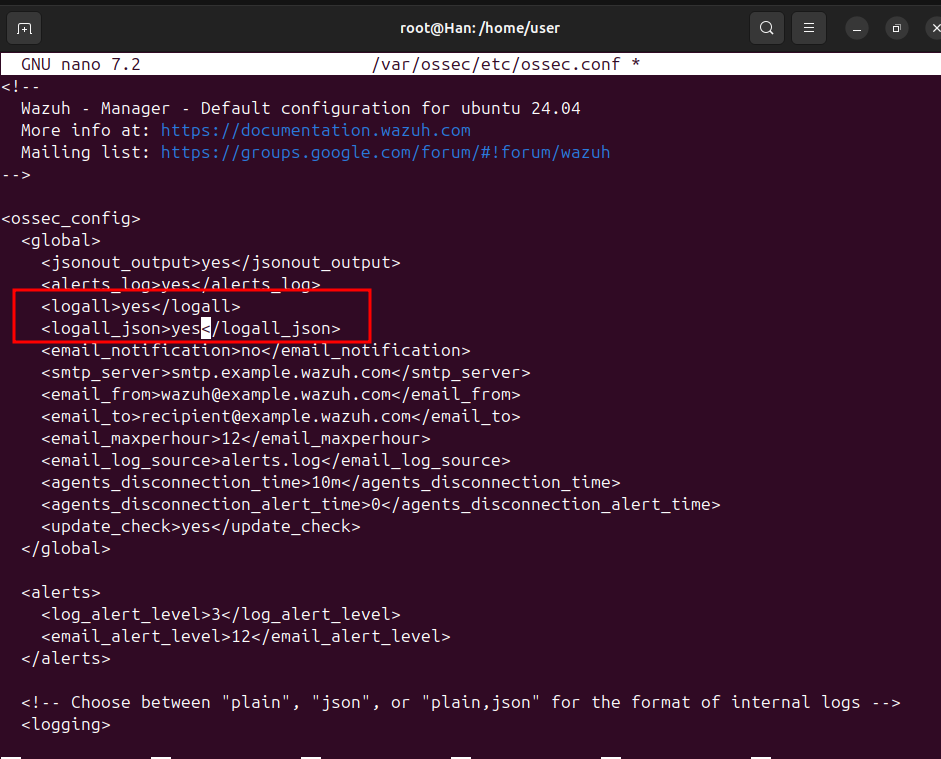
To ensure all raw logs, including those that do not immediately trigger an alert, are stored for later analysis, I modified the ossec.conf file. Specifically, I changed the logall and logall_json parameters from "no" to "yes" within the global configuration. This enables full fidelity logging, which is essential for detailed investigations and custom rule development.
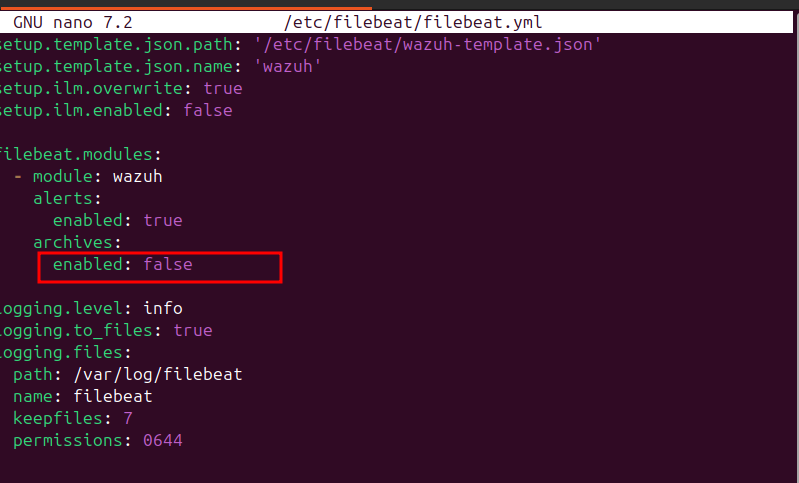
To complement the full log collection enabled in Wazuh, I modified the filebeat.yml configuration. Specifically, I set archives: enabled to true under the filebeat.modules.wazuh.alerts section. This ensures that raw, non-alerting logs, which are critical for in-depth analysis and custom rule creation, are also ingested into Elasticsearch for comprehensive visibility.
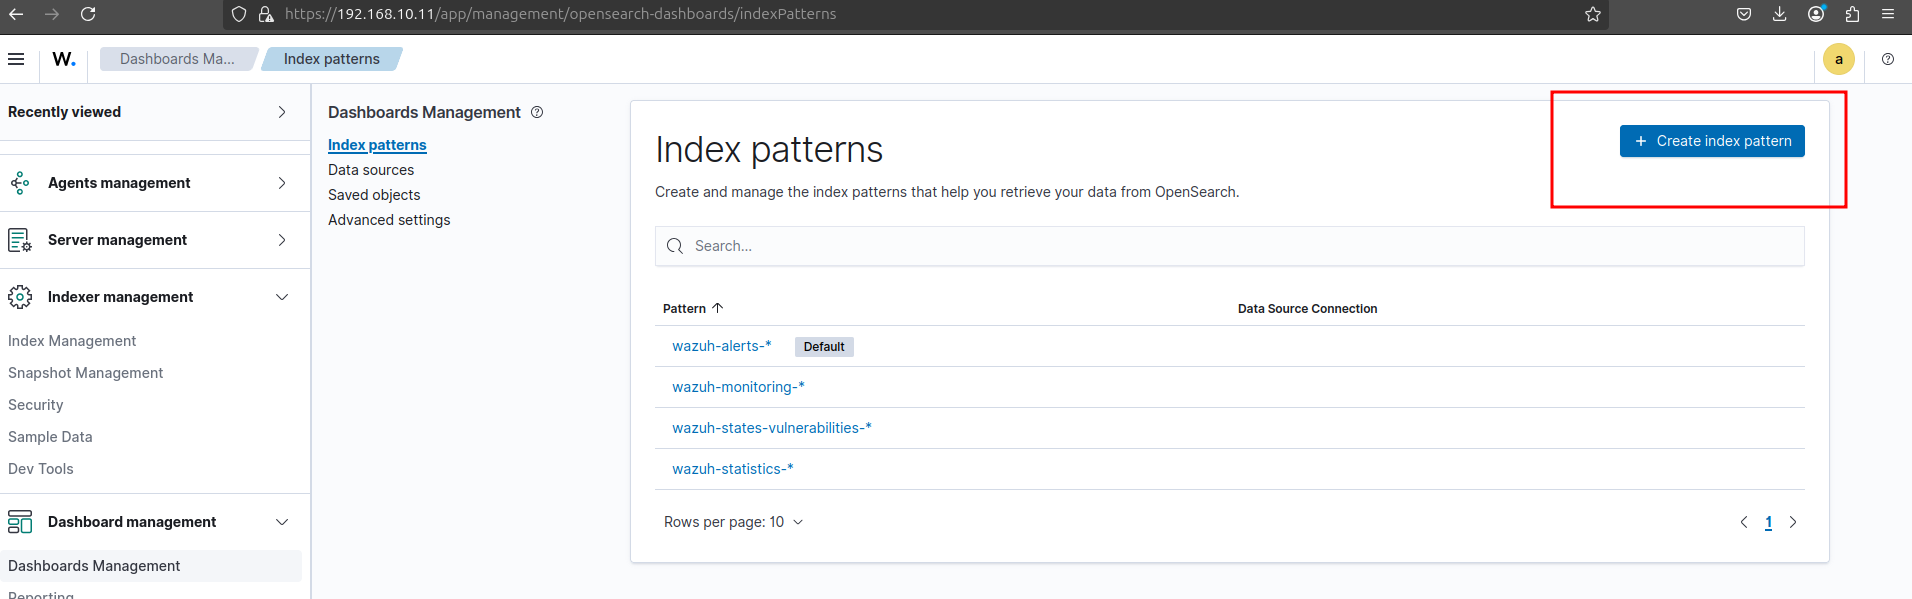
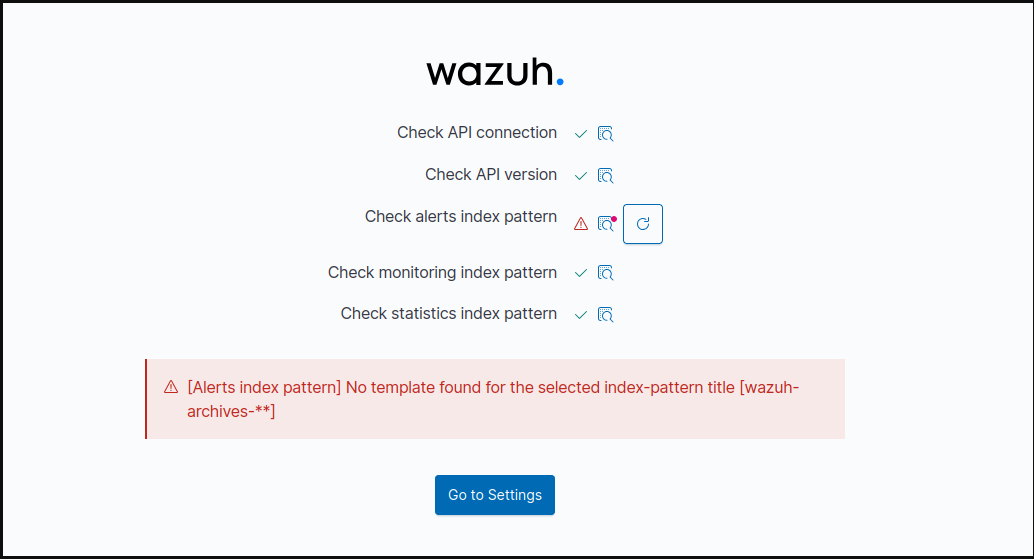
To prepare for analyzing the newly enabled full logs, I navigated to "Dashboards Management" within the Wazuh interface, then selected "Index patterns" to create a new index pattern. This is the next step to ensure that the raw log data, including archival logs, is properly indexed and searchable for analysis.

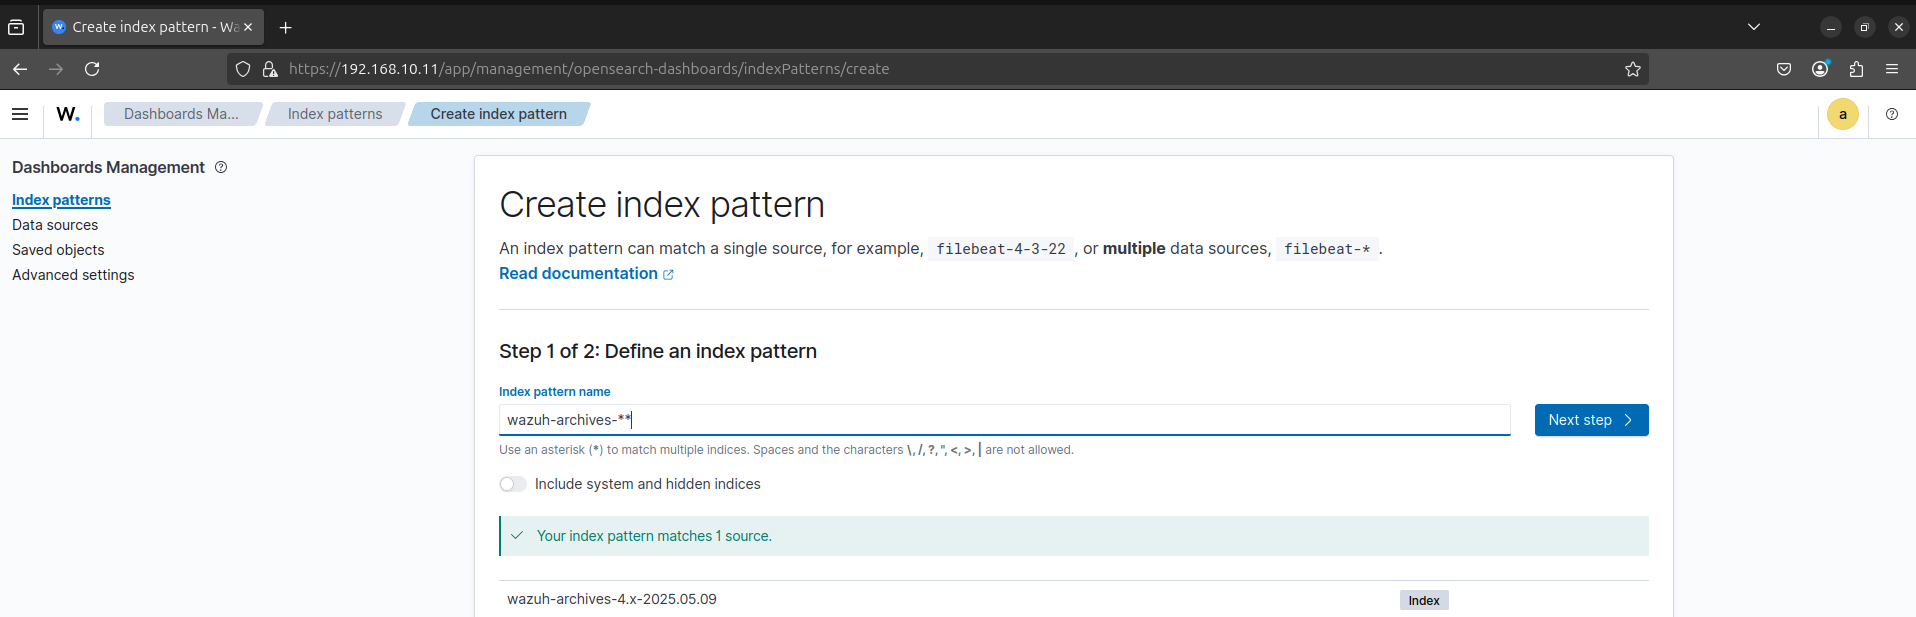
But this one gave me an error.
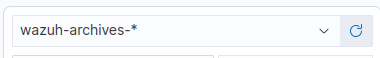
I tried to create new index pattern with a single * then it worked.
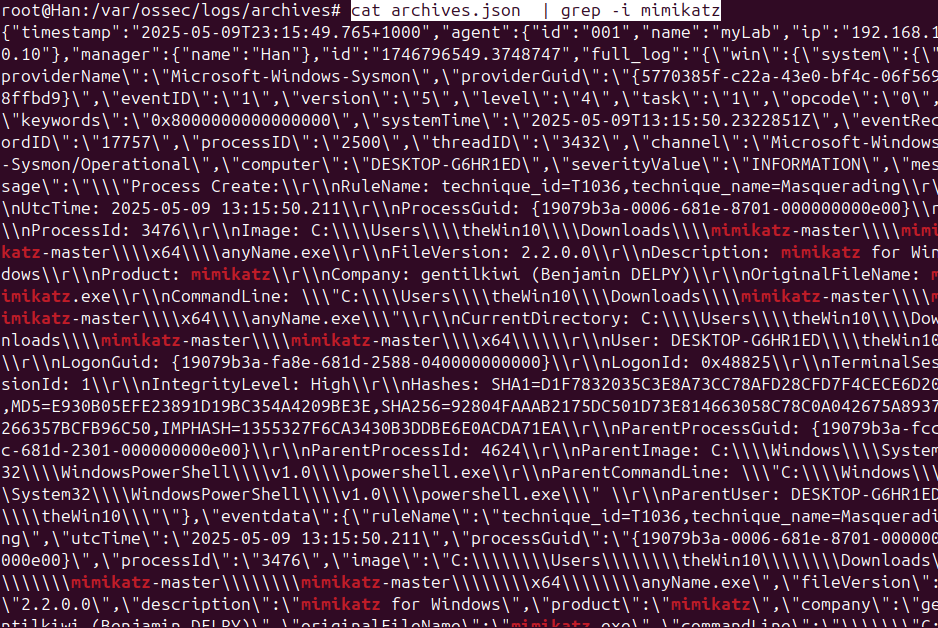
To confirm that Sysmon successfully captured the Mimikatz execution and Wazuh archived the raw event, I used cat archives.json piped through grep -i mimikatz. The output clearly shows the detailed Sysmon event logs related to the Mimikatz process, confirming that our comprehensive logging setup is effectively collecting even non-alerting security events. This data is now available for further analysis and custom rule creation.
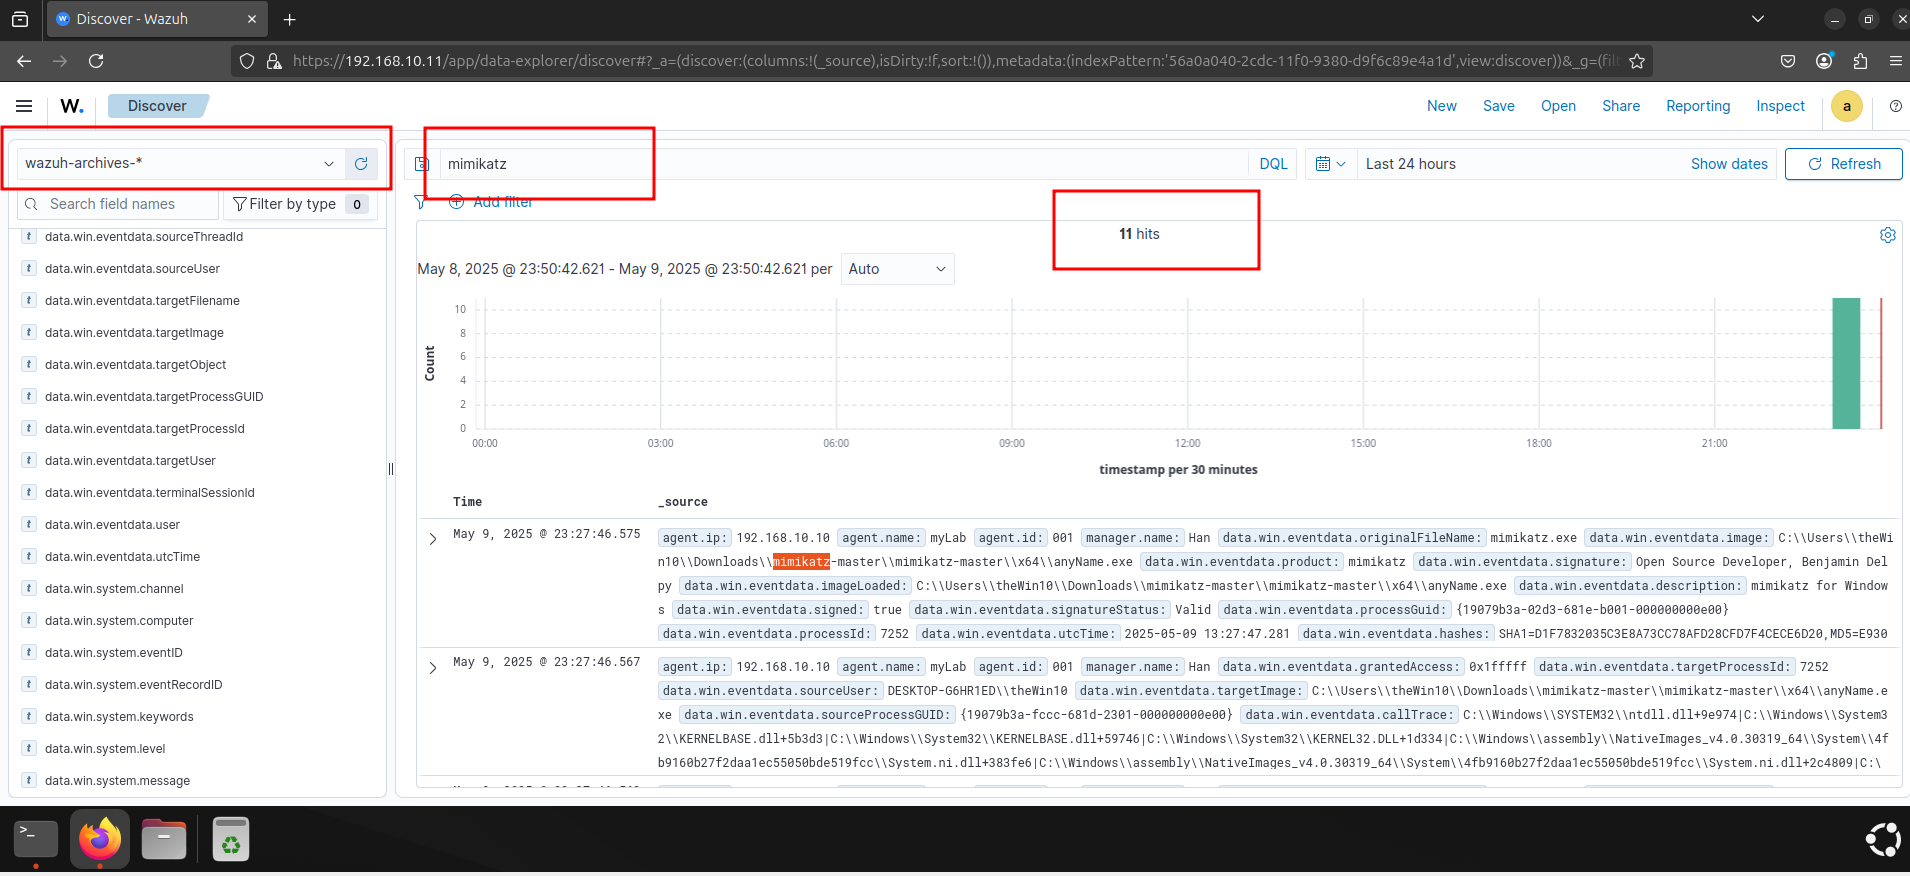
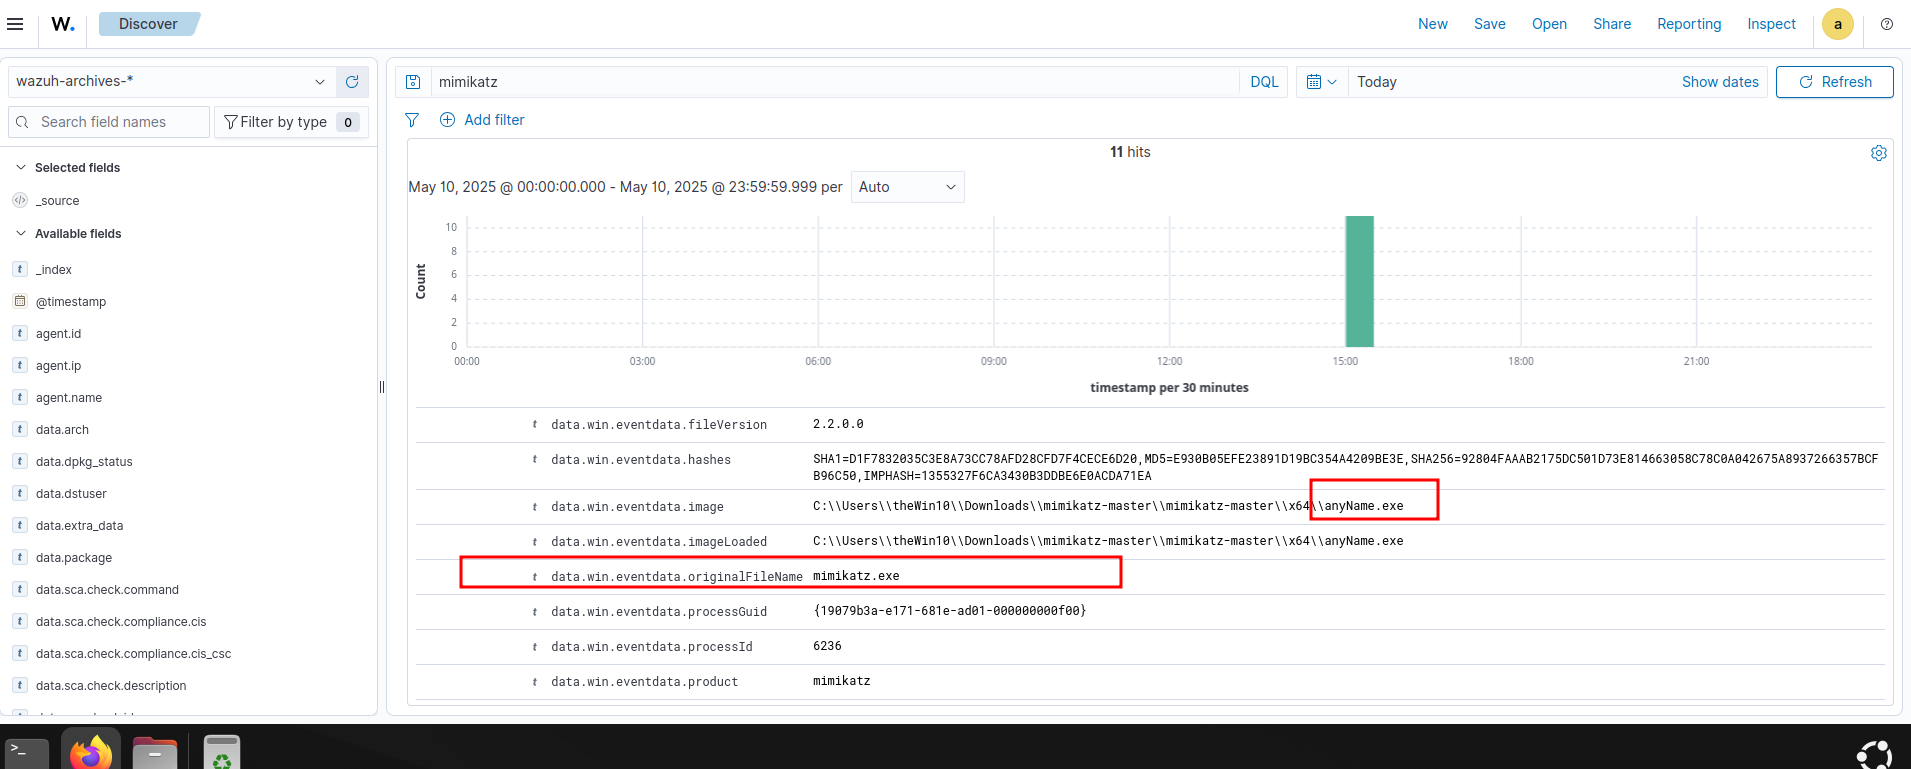
After enabling full log collection and verifying the raw archives.json file, I searched the Wazuh dashboard's "wazuh-archives-*" index for "mimikatz" events. The successful query, showing "11 hits" and displaying the detailed Sysmon logs related to Mimikatz execution, confirms that the raw, non-alerting events are now fully searchable and accessible within the Wazuh interface.
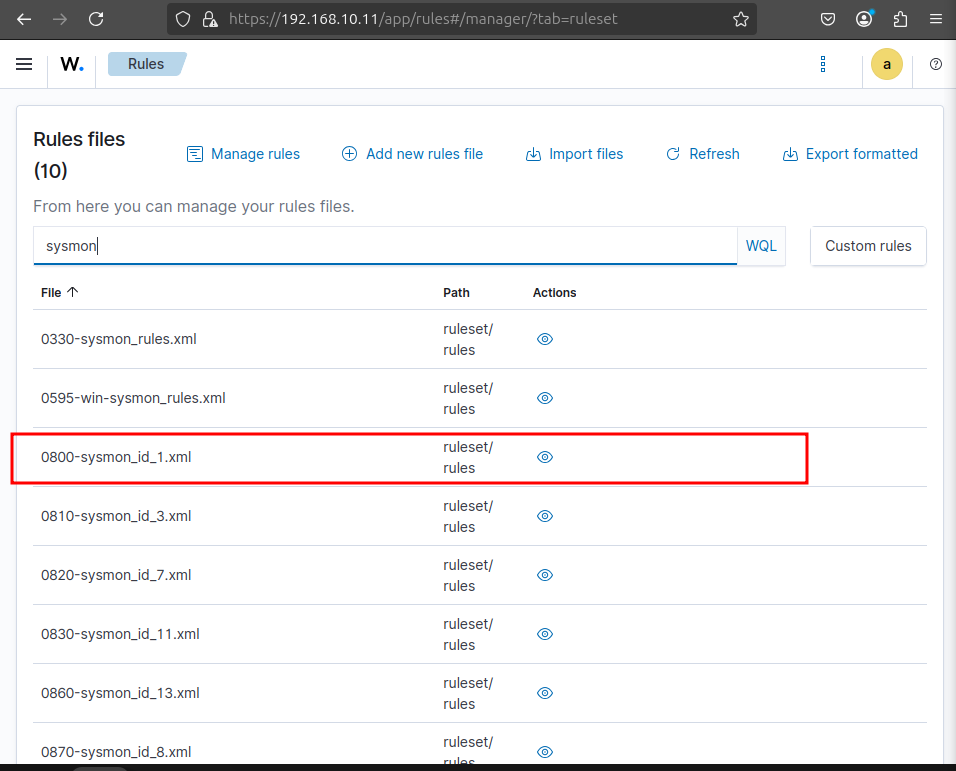
To create a custom rule for Mimikatz detection, I navigated to "Server Management" -> "Rules" -> "Manage Rule Files" in the Wazuh dashboard. Here, I identified 0800-sysmon_id_1.xml as the appropriate file within the ruleset/rules directory. This is where we'll add our specific detection logic for the Mimikatz activity.
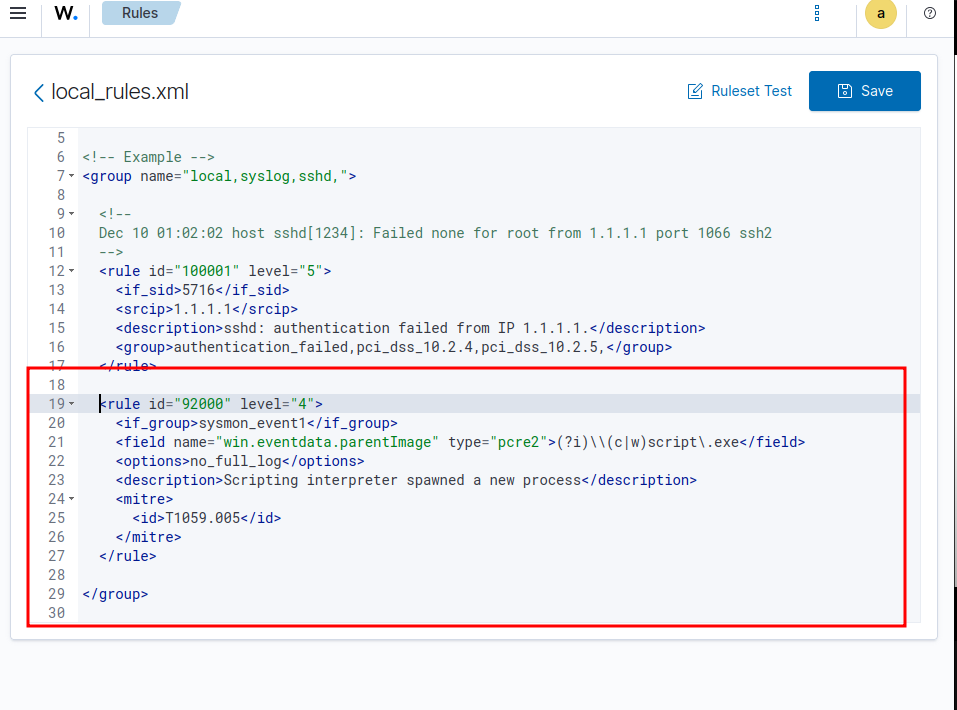
Copy one of them to build your custom rule.

Create custom rule -> local_rules -> paste here
Before defining the custom detection rule, I analyzed the archived Mimikatz logs in the Wazuh dashboard. Specifically, I extracted the data.win.eventdata.originalFileName field, which contains "mimikatz.exe". This unique and reliable indicator will be used as a key element in our custom rule to accurately detect future Mimikatz executions.
With the relevant log data identified, I crafted a custom rule within local_rules.xml to detect Mimikatz execution. This rule is designed with the highest critical level="15" and specifically targets originalFileName for "mimikatz.exe" (case-insensitive). I also linked it to MITRE ATT&CK T1003 (OS Credential Dumping), providing immediate threat context.

Now it's time to test. Here's Wazuh dashboard before i'm re-executing mimikatz.exe
Executing mimikatz.exe
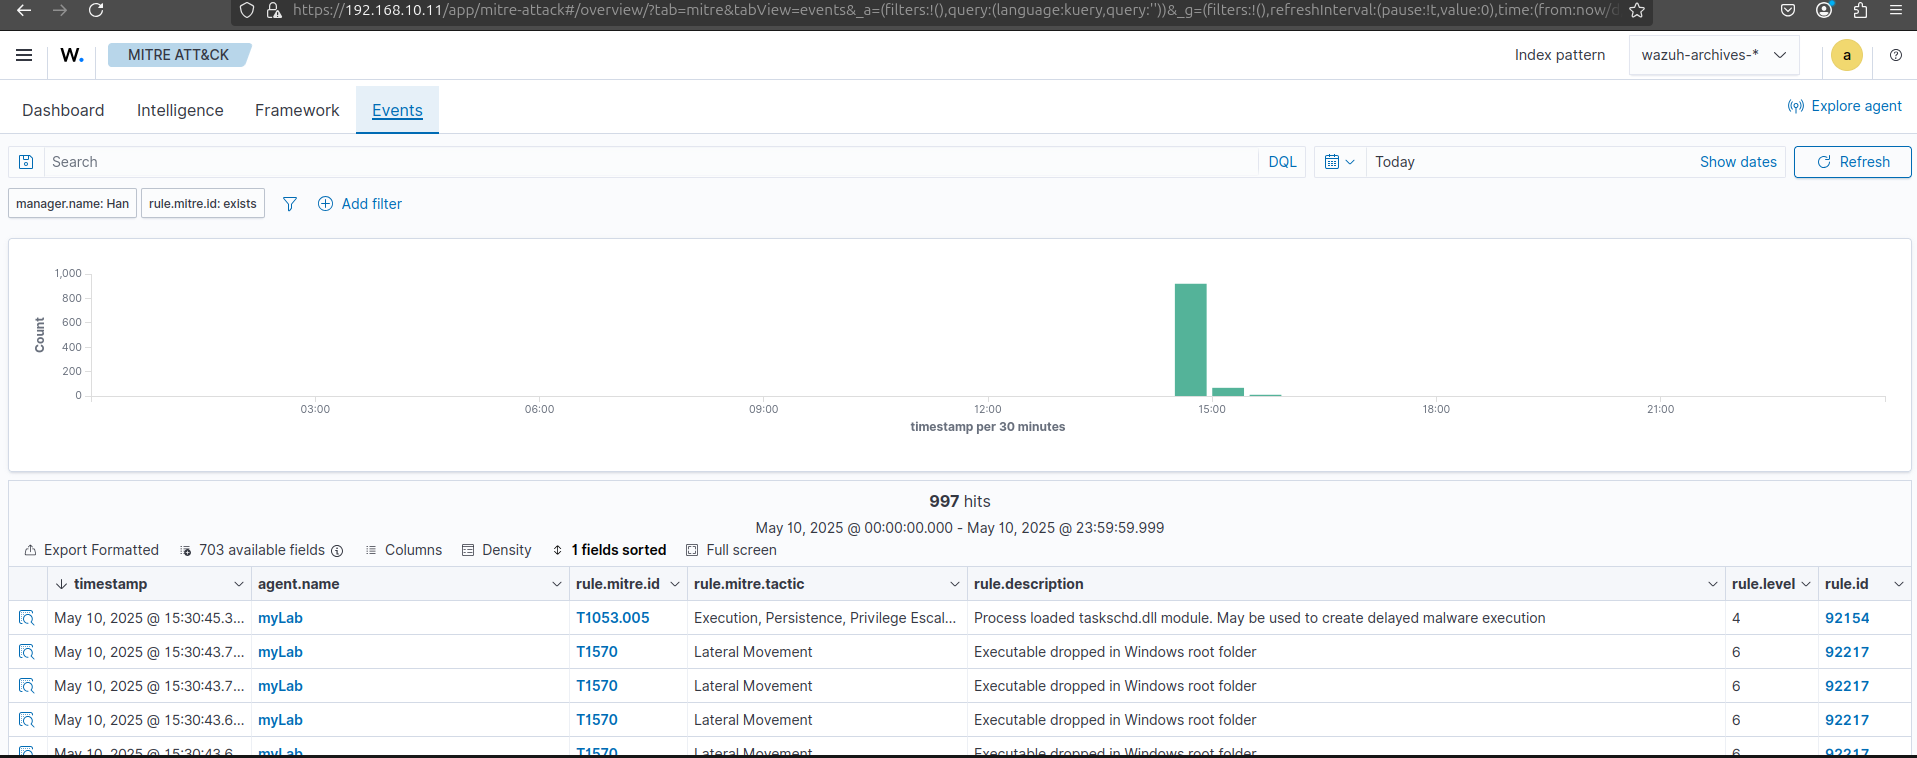
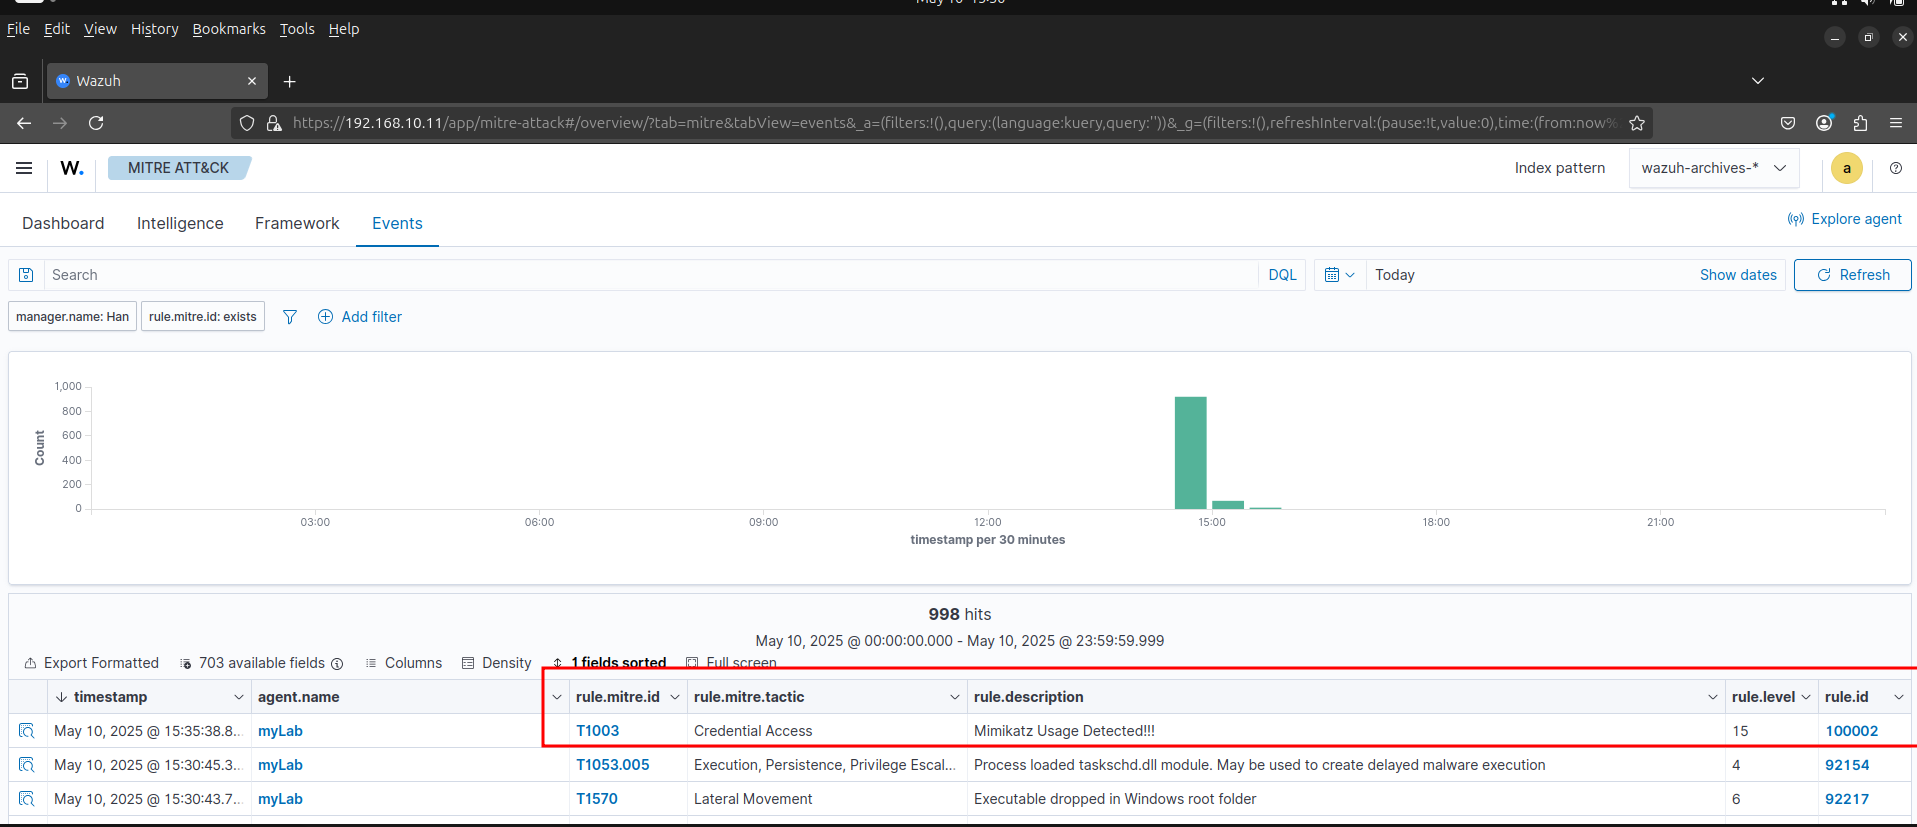
After restarting the Wazuh manager and re-executing Mimikatz on the Windows 10 endpoint, our custom detection rule immediately triggered a high-severity alert. As highlighted, the Wazuh dashboard now displays a new event with rule.mitre.id as T1003 (Credential Access) and rule.description clearly stating "Mimikatz Usage Detected!!!".
Integrating SOAR
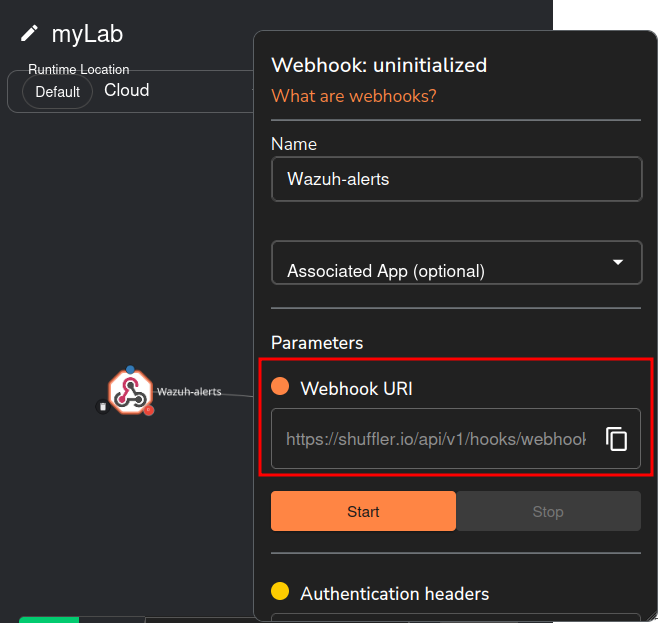
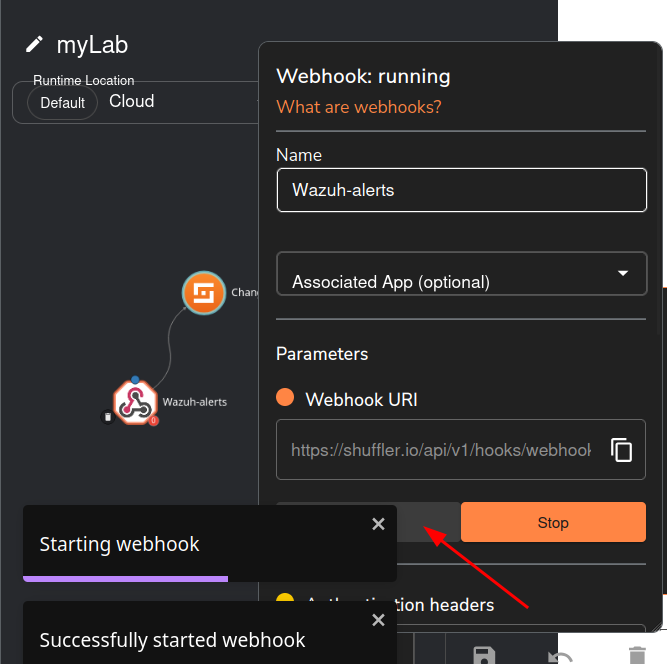
Now, to enable automated incident response, I'm integrating Shuffle, our SOAR platform, with Wazuh. This screenshot shows the initial configuration within Shuffle, where I'm setting up a new "Wazuh-alerts" webhook. The critical step here is obtaining the unique "Webhook URI" (https://shuffler.io/api/v1/hooks/webhook), which will act as the communication channel for Wazuh alerts to be sent to Shuffle for orchestration and automation. This setup lays the groundwork for Shuffle to receive and process security alerts.
I'm going to follow https://wazuh.com/blog/integrating-wazuh-with-shuffle/
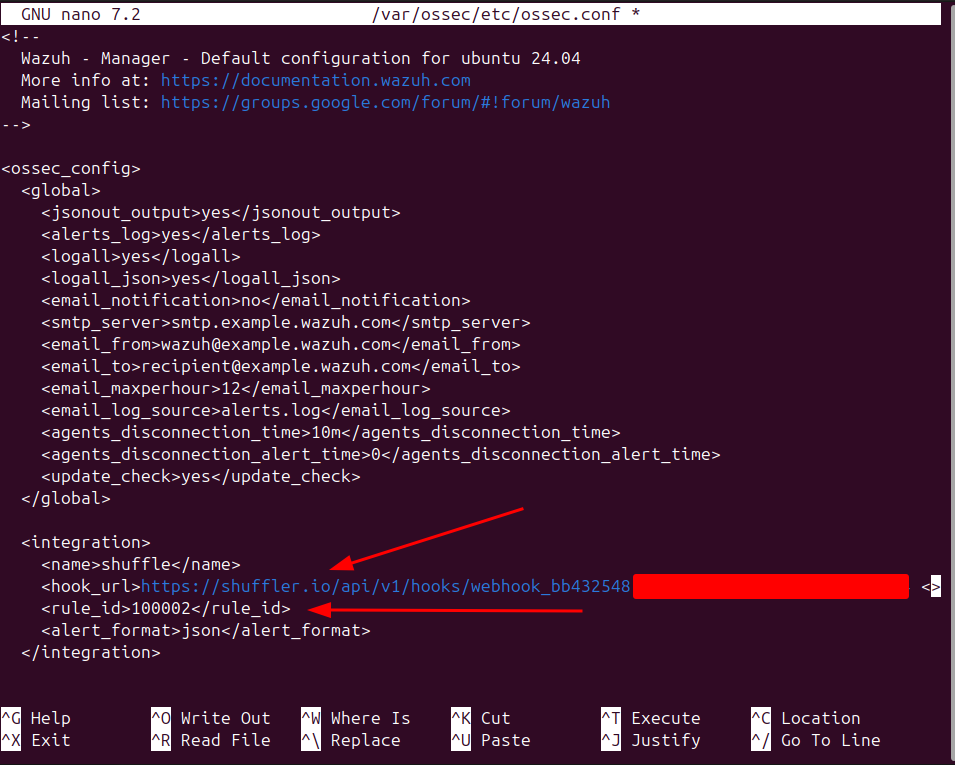
To bridge Wazuh and Shuffle, I modified the ossec.conf file on the Wazuh Manager, adding an <integration> block. As highlighted, this configuration directs Wazuh to forward alerts to Shuffle's webhook URI, specifically including our custom Mimikatz alert (rule_id 100002). By specifying alert_format as json, we ensure the alerts are sent in a structured format, enabling seamless parsing and automation within Shuffle.
Following the ossec.conf modifications and restarting the Wazuh service, I initiated the Shuffle webhook. The screenshot confirms its successful activation, displaying "Webhook: running" and a notification indicating "Successfully started webhook."
Here, we can test the workflow.
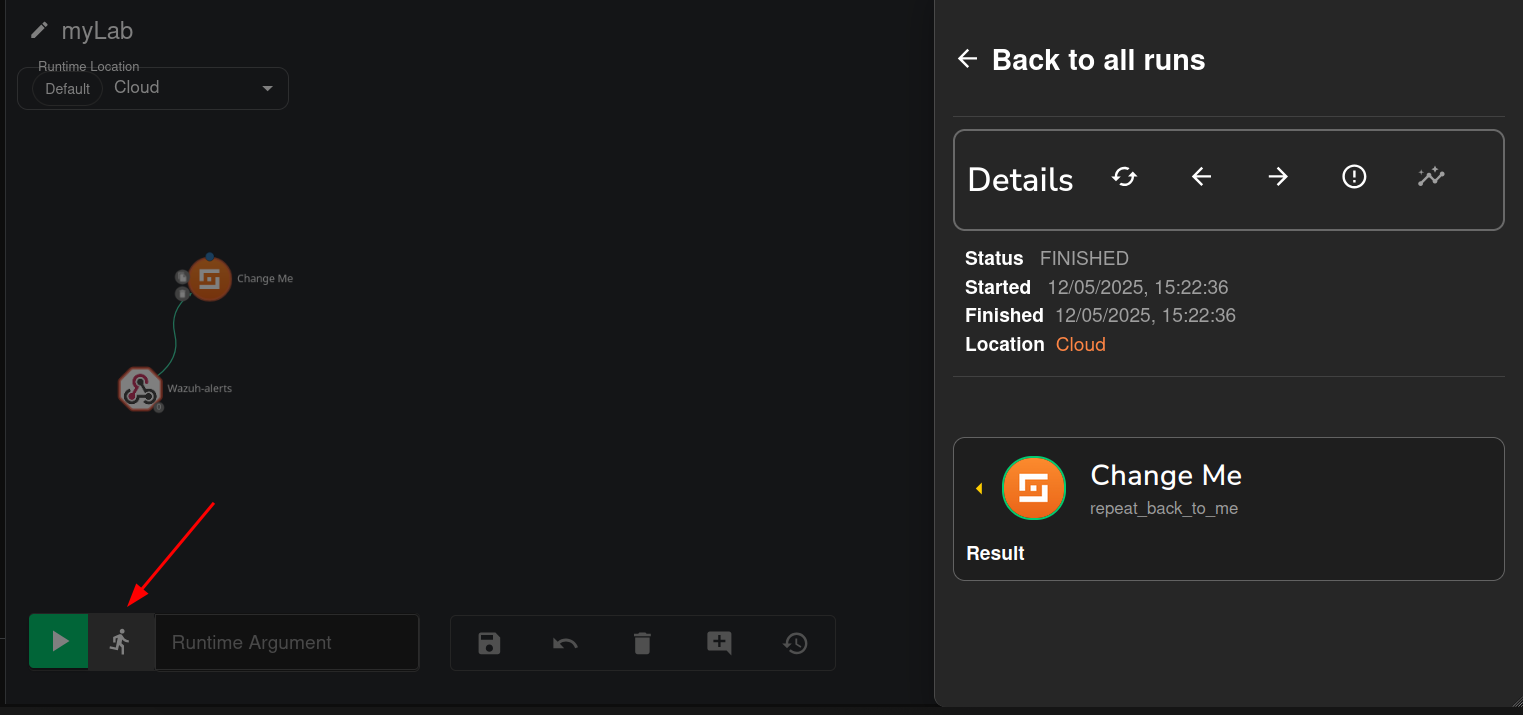
I re-executed Mimikatz on the Windows 10 endpoint. The screenshot confirms that the alert was successfully ingested by Shuffle, showing a "FINISHED" status for the webhook event. Critically, the JSON payload reveals our custom rule_id: "100002", a "Mimikatz Usage Detected!!!" title, and associated details like severity: 3. This validates the seamless flow of high-fidelity alerts from Wazuh to Shuffle, confirming our SOAR platform is ready to automate responses based on critical security events.

Threat Intelligence Enrichment (VirusTotal)
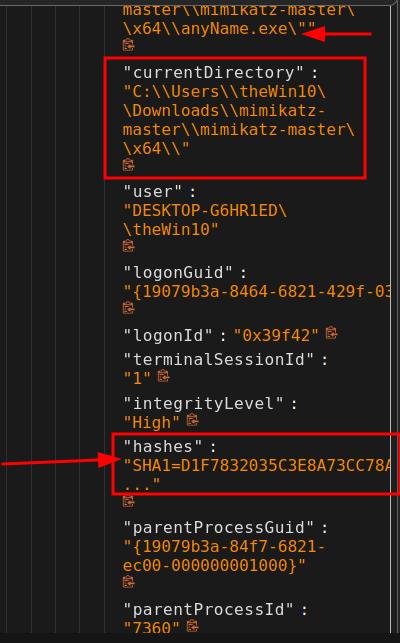
To enrich the alert data and facilitate threat intelligence lookups, the automated workflow needs specific details from the Mimikatz alert. This screenshot displays the raw event data, highlighting the hashes field which contains the SHA1 hash (D1F783...). Crucially, within this same log, the SHA256 hash is also present, which will be the primary identifier used for reputation checks. This extraction step is vital for context-rich incident analysis.
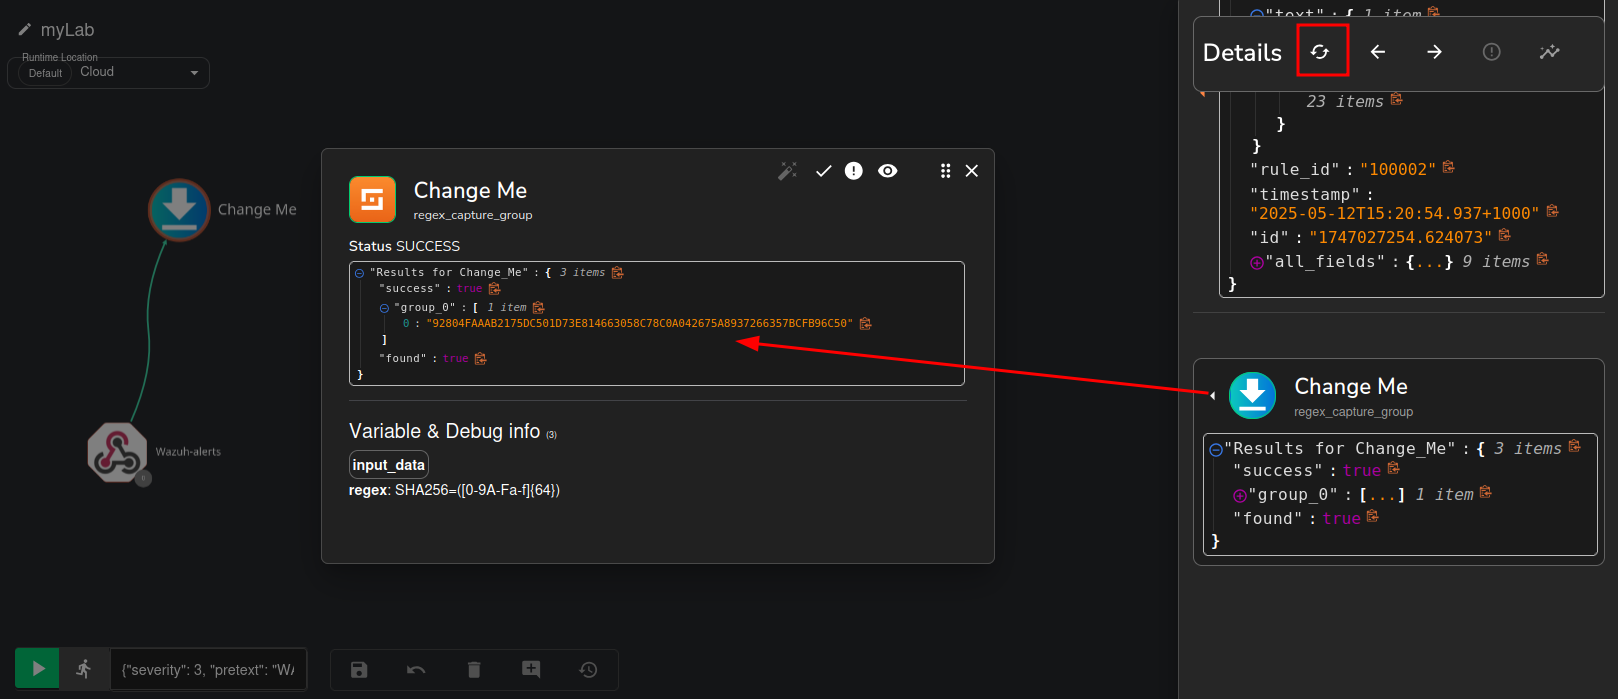
To automate the VirusTotal lookup, I implemented a "Regex capture group" action within Shuffle. This step is for extracting the SHA256 hash from the incoming Wazuh alert. As shown, the Input data is set to $exec.text.win.eventdata.hashes, targeting the field containing the hash string. The Regex used, SHA256=([0-9A-Fa-f]{64}), precisely identifies and captures the 64-character SHA256 value. This ensures that only the relevant hash is extracted, preparing it for the next step in our automated workflow.

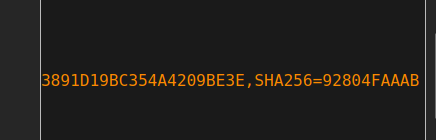
Here we can confirm extraction of the SHA256 hash.
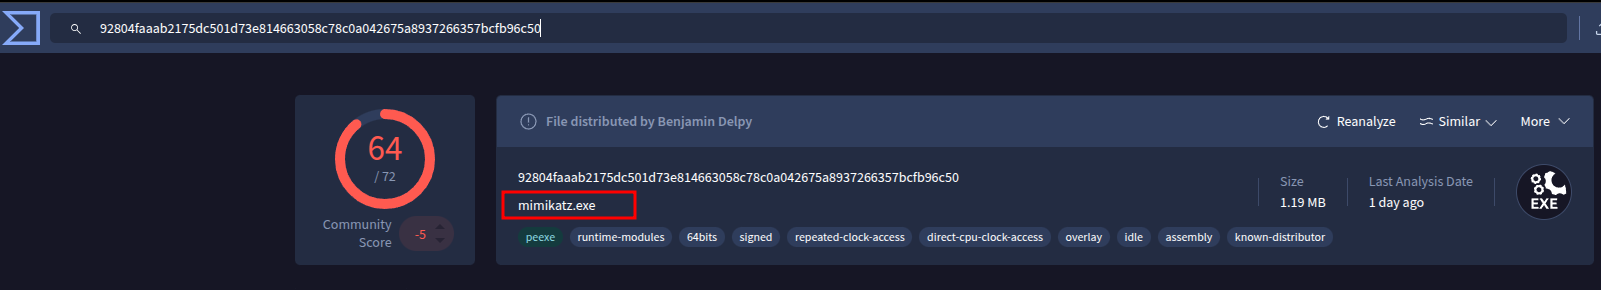
With the SHA256 hash successfully extracted, I performed a lookup on VirusTotal to gather reputation information about the Mimikatz executable. It's time to use my VirusTotal API key to be able to parse this information.
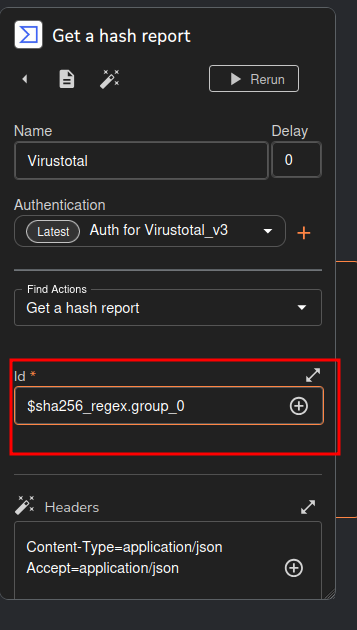
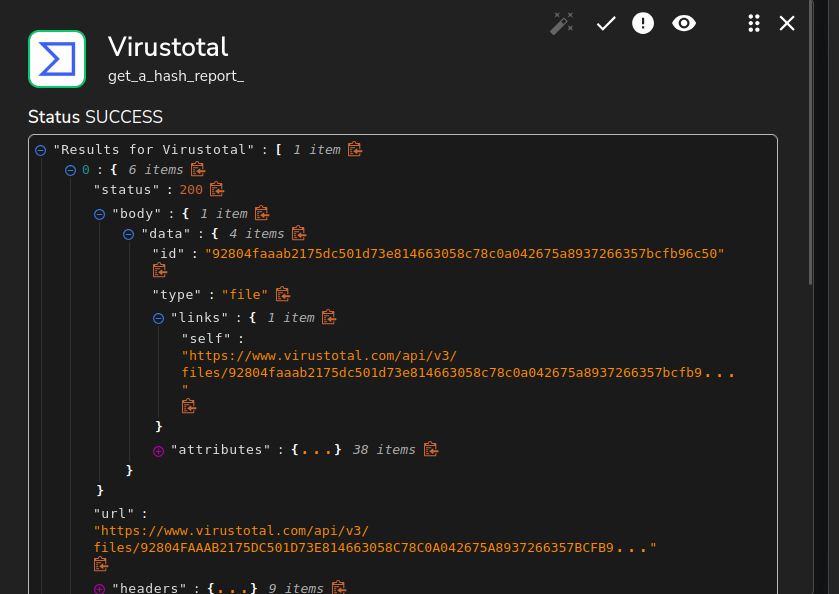
I set up a "Get a hash report" action within Shuffle. Here, I made sure to connect the extracted SHA256 hash to the VirusTotal query. You can see the Id field is populated with $sha256_regex.group_0, which pulls the hash directly from our previous parsing step. This ensures Shuffle automatically sends the right hash to VirusTotal for reputation analysis, weaving external threat intelligence right into our automated workflow.
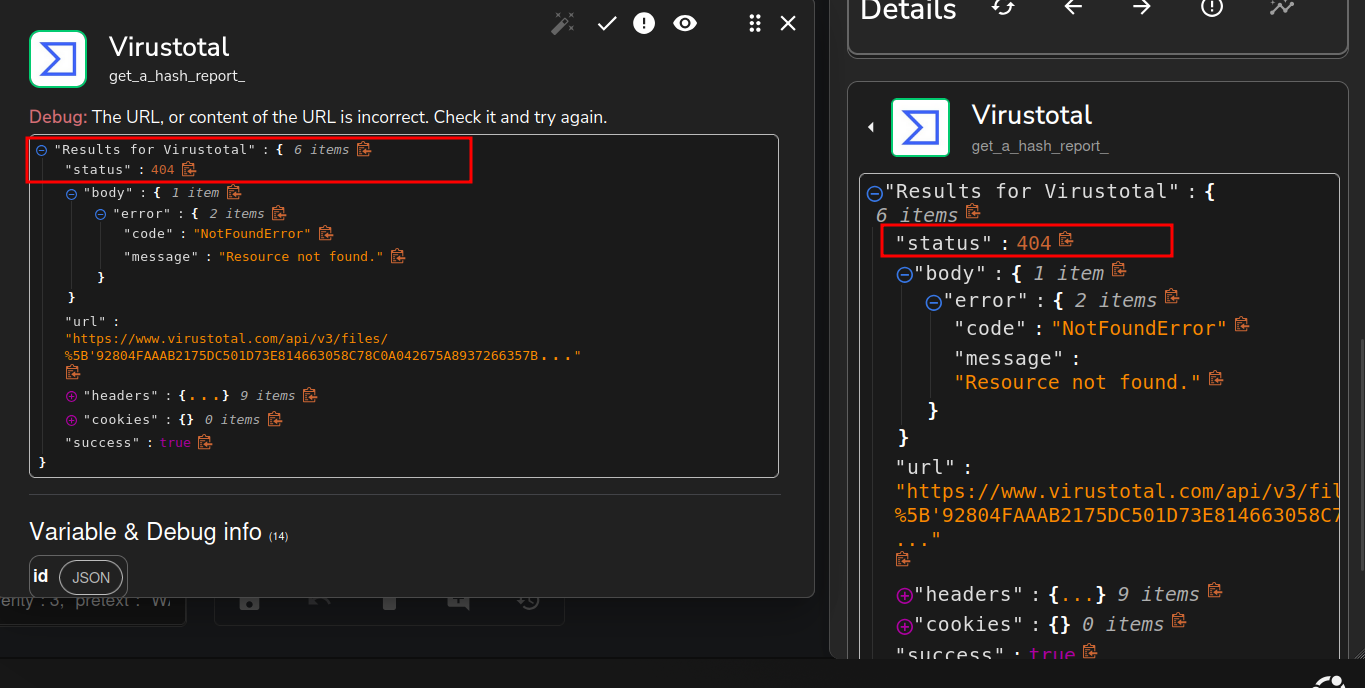
Troubleshooting: VirusTotal API Error! After configuring the VirusTotal lookup, the workflow encountered an error. The screenshot shows a status: 404 and an error message "Resource not found." This indicates that the API endpoint or the way the hash was being sent to VirusTotal was incorrect, preventing a successful lookup.
To resolve the "Resource not found" error, I reviewed the available VirusTotal API actions within Shuffle. Here we can see the correct endpoint for retrieving a hash report: GET /files/{id}.
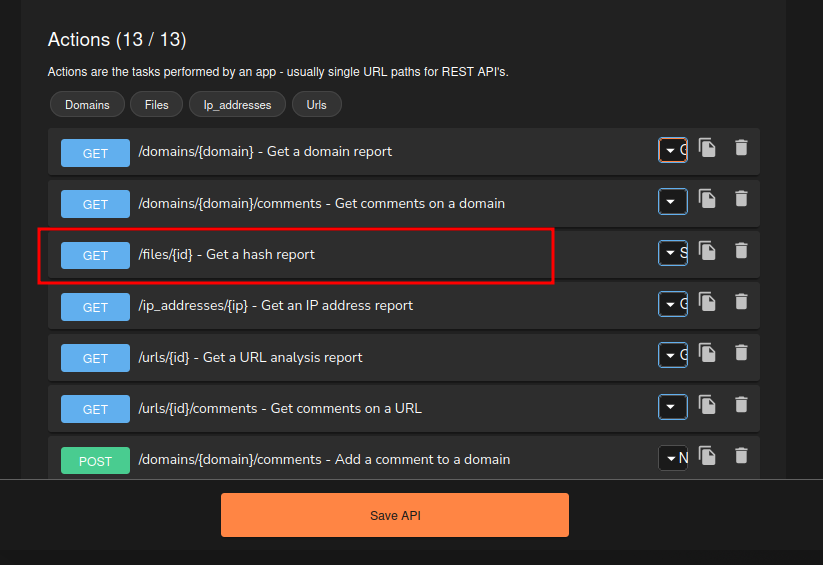
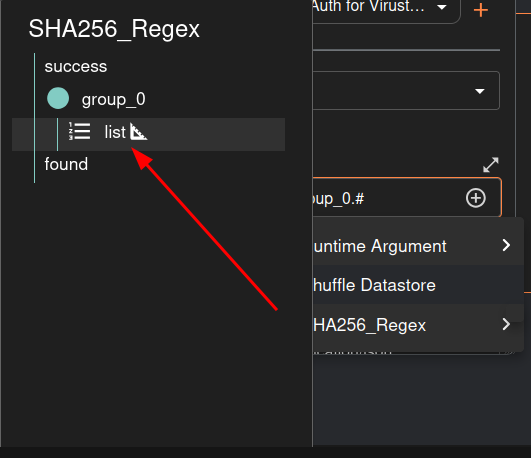
It means i just provided the wrong regex. i had to pick “list” here.
Here's the correct identifying API endpoint.

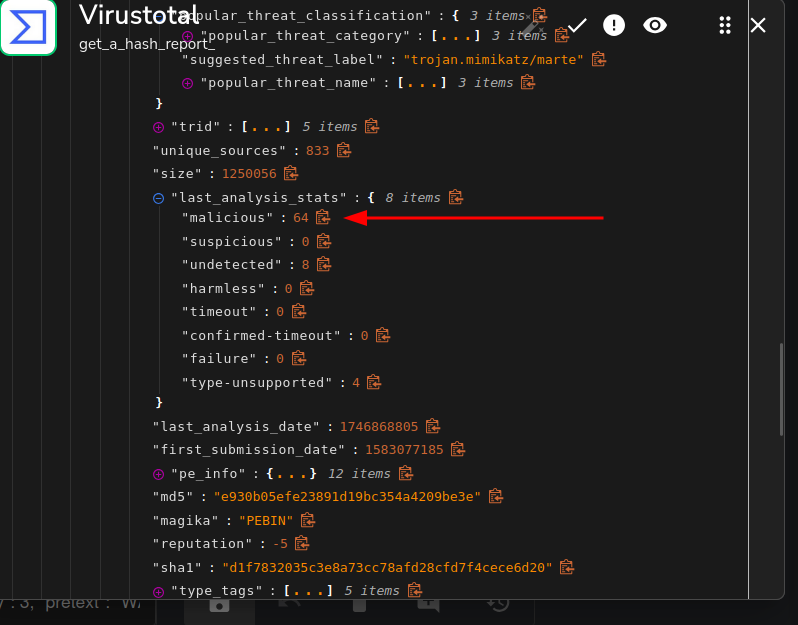
After correcting the API endpoint, the VirusTotal lookup within Shuffle now shows a successful result. The output clearly indicates malicious: 64 under last_analysis_stats, confirming that 64 out of the analyzed security vendors identified the file as malicious. This successful integration provides immediate, actionable threat intelligence directly within our automated workflow, verifying the malicious nature of the Mimikatz executable.
TheHive Integration
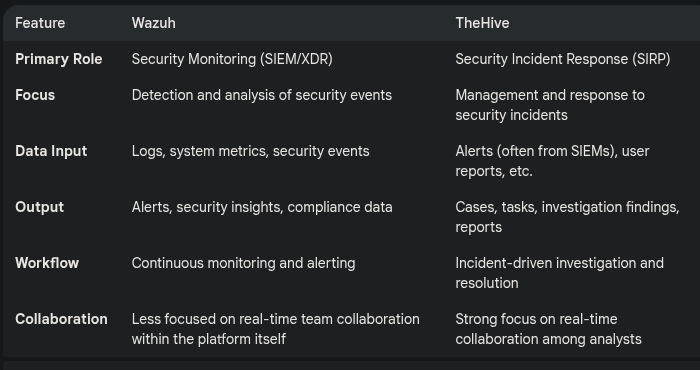
Why do we need TheHive
I am going to follow here : https://wazuh.com/blog/using-wazuh-and-thehive-for-threat-protection-and-incident-response/
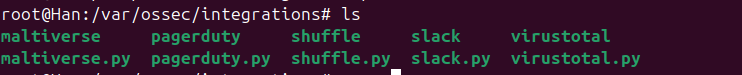
To begin integrating TheHive directly with Wazuh, I first navigated to the /var/ossec/integrations directory on the Wazuh Manager. Listing the contents of this directory, as shown, reveals the existing integration scripts such as shuffle.py, virustotal.py, and slack.py. This step confirms the location where custom integration scripts, like the one we'll use for TheHive, are stored and executed by Wazuh.
To facilitate direct integration between Wazuh and TheHive, I created a new custom script named custom-w2thive within the /var/ossec/integrations directory. This script, written in Python, will act as the bridge, processing Wazuh alerts and forwarding them to TheHive. This custom solution allows for tailored incident creation and management directly from Wazuh, bypassing the need for an intermediary SOAR platform like Shuffle for this specific integration.
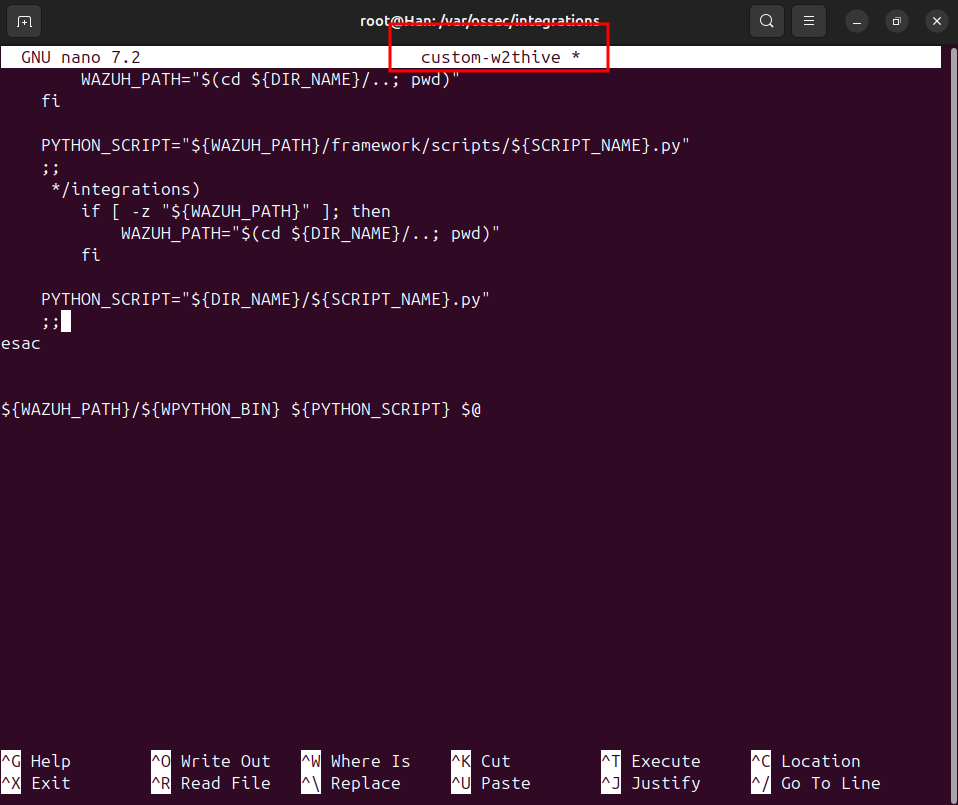
Here's the file i created.
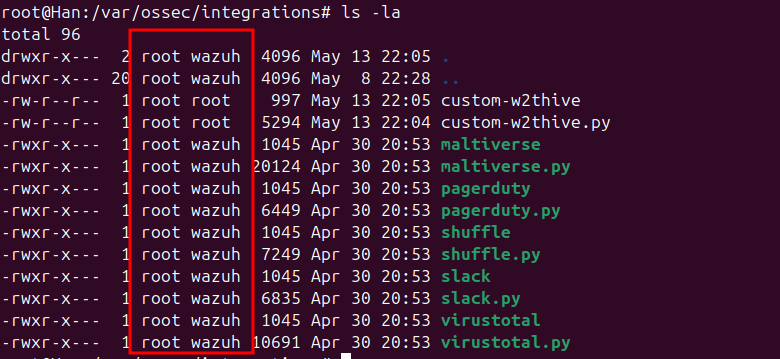
It need the correct permissions, so i have to run these commands :sudo chmod 755 /var/ossec/integrations/custom-w2thive.pysudo chmod 755 /var/ossec/integrations/custom-w2thivesudo chown root:wazuh /var/ossec/integrations/custom-w2thive.pysudo chown root:wazuh /var/ossec/integrations/custom-w2thive
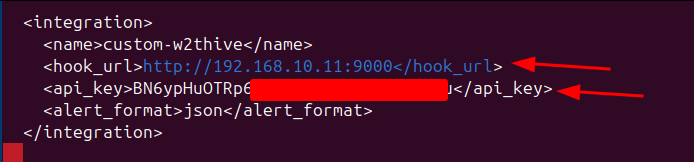
To activate the direct integration, I modified the ossec.conf file on the Wazuh Manager, adding a new <integration> block for custom-w2thive. Here we can see the configuration details: the hook_url is set to TheHive server's IP and port 9000, and a dedicated api_key is provided for authentication. The alert_format is specified as json to ensure structured data transfer.
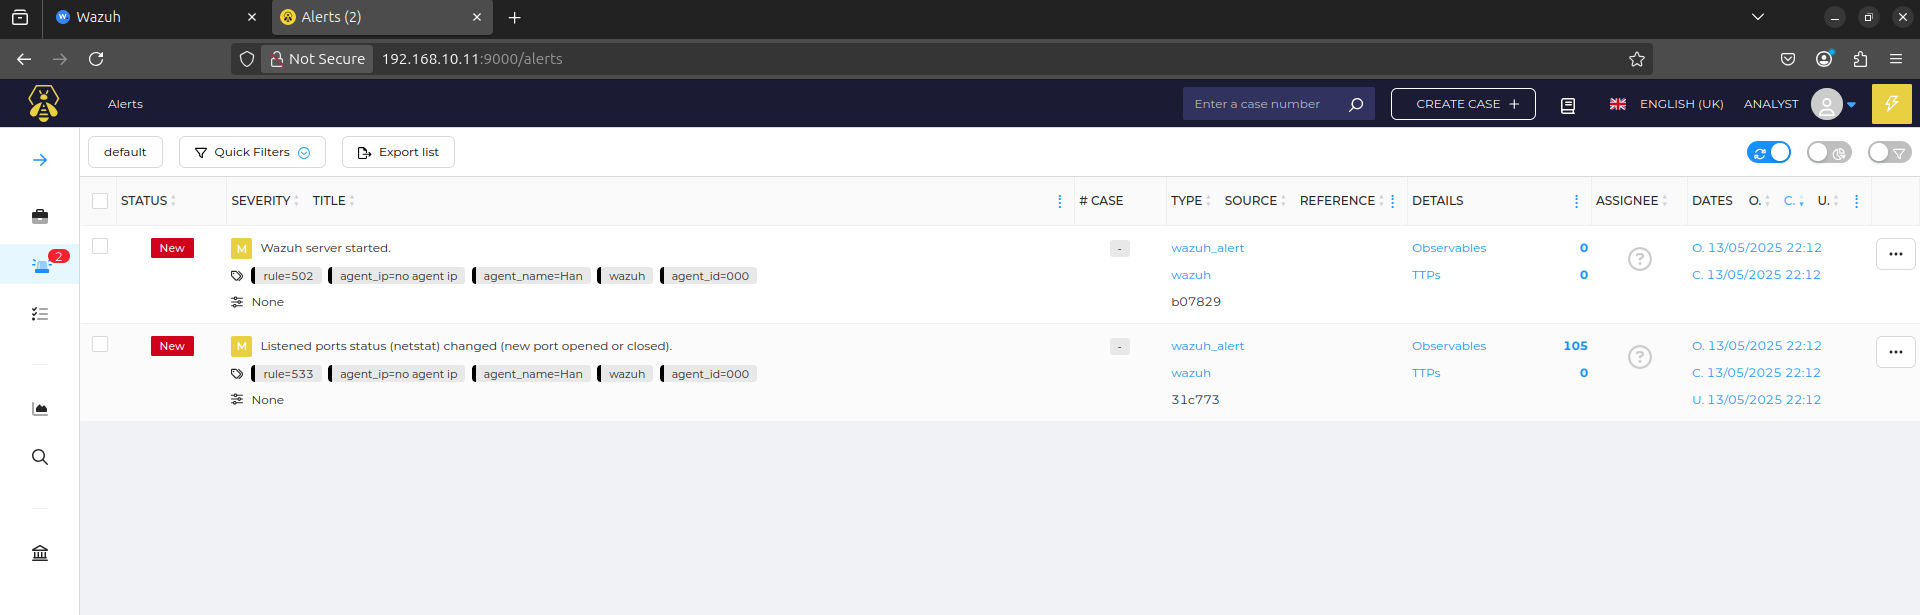
After restarting the Wazuh service, I navigated to TheHive's alert dashboard to verify the integration. Here we can see new alerts successfully received from Wazuh.
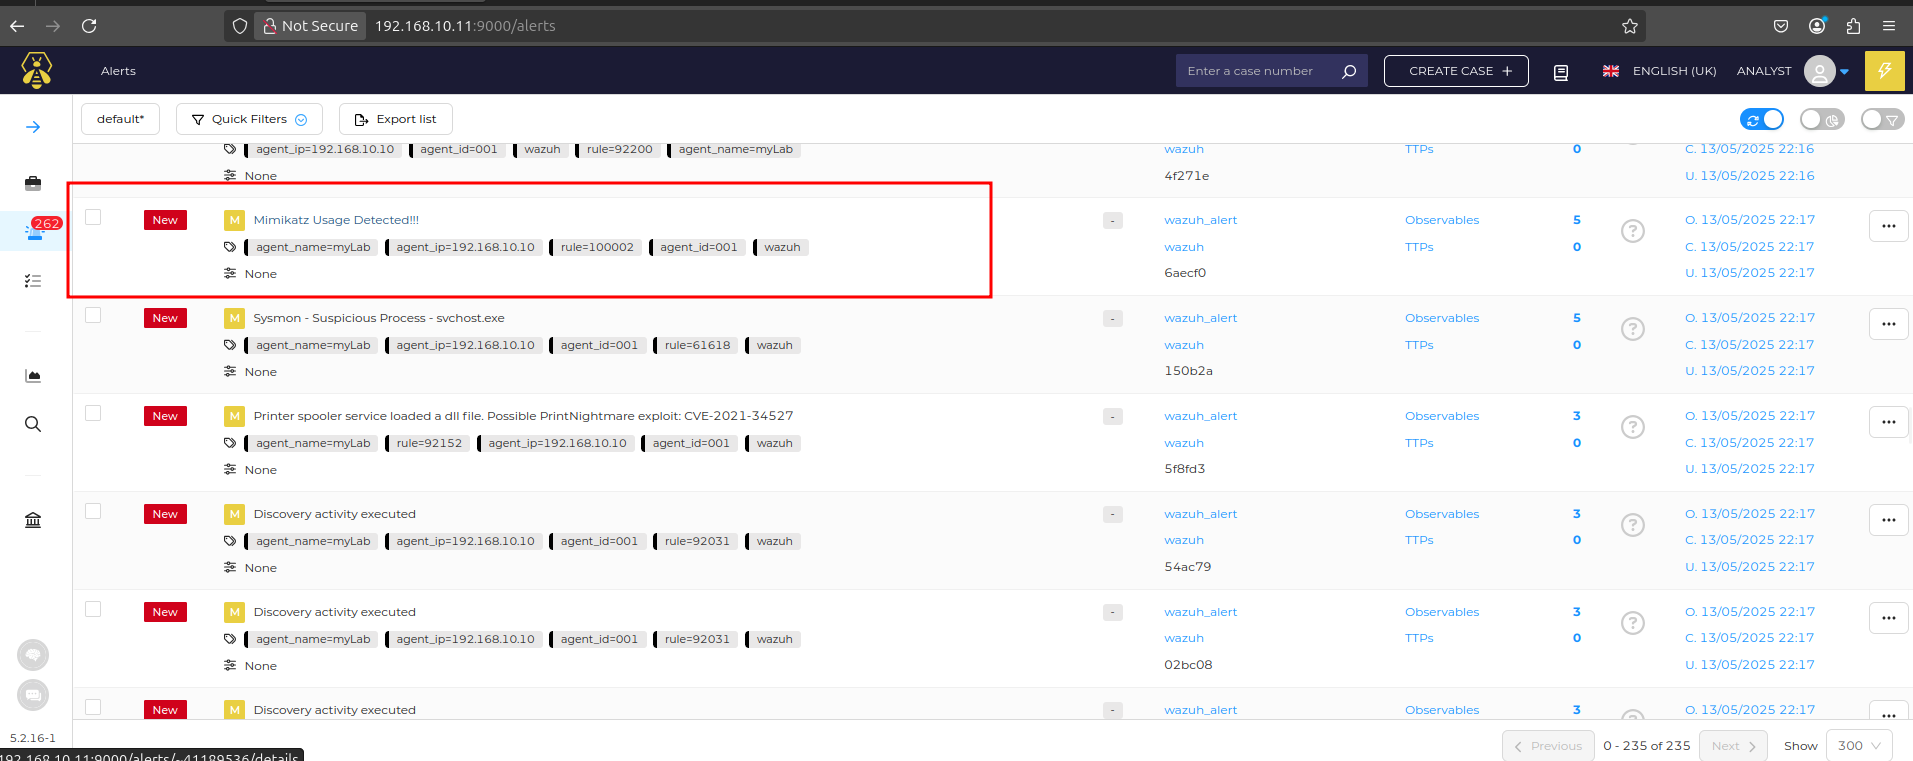
After re-executing Mimikatz on the Windows 10 endpoint, TheHive's alert dashboard immediately displayed a new, critical alert. As highlighted, the alert is titled "Mimikatz Usage Detected!!!" and directly references our custom Wazuh rule (rule.id: 100002). This confirms the seamless end-to-end integration: Wazuh detected the threat, and the custom integration script successfully forwarded the alert to TheHive for immediate case management. This automated alert creation significantly reduces response time and ensures critical incidents are promptly addressed.

Automated Notification: Sending Email to Analyst
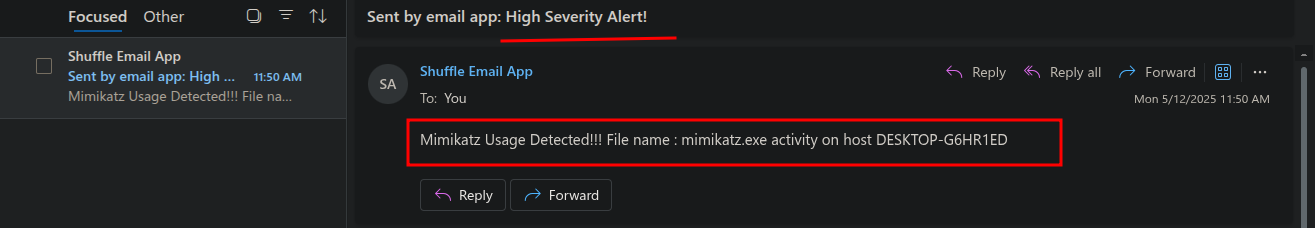
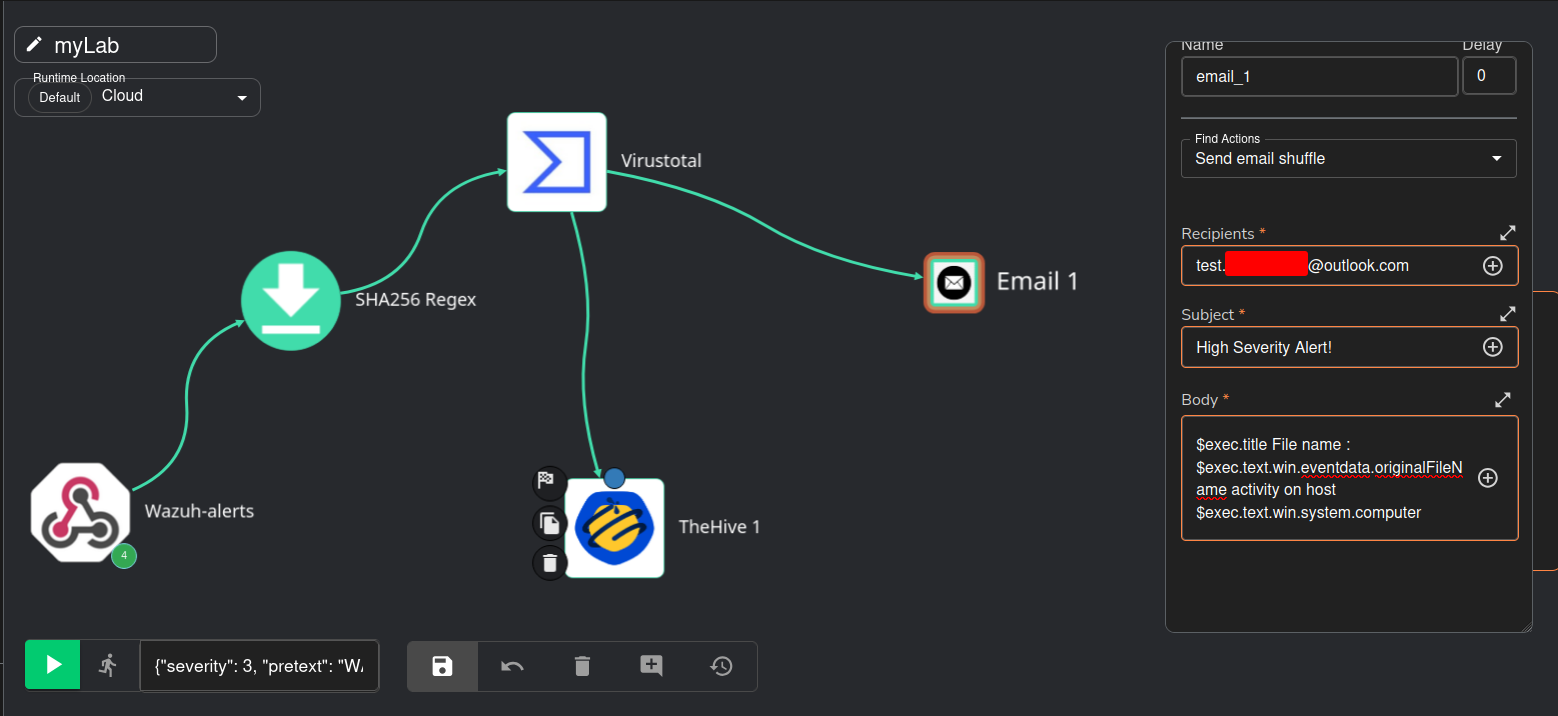
To ensure the analyst is immediately notified of critical incidents, I added a "Send email shuffle" action to our workflow. Here we can see the email configuration: the recipient is set to test@outlook.com, the subject line is "High Severity Alert!", and the body dynamically populates key alert details. This includes the alert title ($exec.title), the original filename ($exec.text.win.eventdata.originalFileName), and the affected host ($exec.text.win.system.computer). This automated email ensures timely communication and prompts the analyst to begin their investigation in TheHive.
After the full workflow execution, here we can see the successful delivery of the automated email notification to the analyst. The email, sent by the "Shuffle Email App," has the subject "High Severity Alert!" and dynamically includes critical details: "Mimikatz Usage Detected!!! File name: mimikatz.exe activity on host DESKTOP-G6HR1ED." This final step in the SOAR playbook ensures that analysts are promptly informed of high-priority incidents, enabling them to initiate investigations swiftly.